natural gas prices at a new 13 year high as heating season ends with supplies lowest in 3 years; Strategic Petroleum Reserve at a 20 year low; US distillates exports at a 45 month high leaves domestic distillates supplies at an 8 year low; oil product exports at an all time high; global oil surplus hits 710,000 barrels per day in March despite 821,000 barrel per day OPEC shortfall; natural gas drilling at a 30 month high
oil prices recovered from early losses to end higher for the first time in three weeks after Ukrainian peace talks failed and the EU considered a ban on Russian oil imports...after falling more than 1% to $98.26 a barrel last week after the IEA countries joined the US in an unprecedented release of emergency oil reserves, the contract price for US light sweet crude for May delivery tumbled 3% in mid-morning trading on Monday on growing concerns over China's Covid-19 surge and the big oil reserve release from consuming nations and never recovered, settling $3.97 or 4% lower at $94.29 a barrel, with sharp losses spearheaded by tightening lockdowns of China's largest cities as the World Bank slashed China's 2022 growth forecast on the back of their largest Covid-19 outbreak since beginning of the pandemic....but oil prices rebounded on Tuesday, as Shanghai eased lockdown restrictions in some areas and OPEC told the European Union it wouldn’t be possible to replace the Russian supply loss, and then rallied in afternoon trading after both OPEC and the EIA downgraded the global supply outlook through 2023, driven by sharp downward revisions to Russian oil production, which had already been hammered by Western sanctions, and finished $6.31 higher at $100.60 a barrel....oil prices extended their gains in midmorning trading on Wednesday, after Moscow said peace talks with Ukraine had reached a dead end, feeding worries about tight supplies, and closed $3.65 higher at $104.25 a barrel, even after the EIA reported that U.S. crude stocks rose by more than 9 million barrels in the most recent week....but oil prices slid more than 2% early Thursday as Chinese refiners appeared ready to cut crude throughput this month by about 6%, a pullback not seensince the early days of the pandemic, but bounced back as traders covered short positions ahead of the long weekend on news that the European Union might phase in a ban on Russian oil imports, with US May oil closing $2.70 higher at $106.95 a barrel, thus finishing the week 8.8% higher, as traders weighed a global supply deficit, a potential ban on Russian oil from the European Union, and and China’s latest virus lockdowns
Meanwhile, natural gas prices rose for the eighth time in nine weeks and set a new thirteen year high each day this week, as the heating season ended with natural gas supplies at a 3 year low, 24% below their year earlier level....after rising 9.8% to $6.278 per mmBTU last week on falling US gas output and on a bigger than expected decline in gas inventories, the contract price of natural gas for May delivery opened 2% higher on Monday and rallied to gain 36.5 cents to $6.643 per mmBTU, as a bump in production did little to assuage growing concerns about dwindling supplies, especially in light of chilly forecasts for most of this month...prices edged higher again on Tuesday on expectations that a freezing air mass in Canada would boost heating demand as it moved into the US next week. and settled 3.7 cents higher at $6.680 per mmBTU, and then surged 31.7 cents to $6.997 on Wednesday, on forecasts for unusual cold in the Upper Midwest and unusual heat in the Mid-Atlantic states....finally, natural gas prices finished off the short holiday week with another big jump on Thursday, after the latest EIA inventory data confirmed a sluggish start to the injection season, and on expectations that freezing weather in Canada would boost heating demand as it moves into the United States next week. and settled 30.3 cents higher at $7.300 per mmBTU, thus finishing with a 16.3% increase for the week..

the above is a screenshot of the interactive natural gas price chart from barchart.com, which i have set to show front month natural gas prices monthly over the past 10 years, which means you're seeing the range of natural gas prices over that time as they were quoted by the media...this same chart can be reset to show prices of front month or individual monthly natural gas futures contracts over time periods ranging from 1 day to 30 years, as the menu bar on the top indicates, and also to show natural gas prices by the minute, hour, day, week or month for each...each bar in the graph above represents the range of natural gas prices for a single month, with months when prices rose indicated in green, and months when prices fell indicated in red, with the small sticks above or below each monthly bar representing the extent of the price change above or below the opening and closing price for the month in question....likewise, the bars across the bottom show trading volume for the months in question, again with up months indicated by green bars and down months indicated in red...what's noteworthy in this monthly price view is that natural gas prices have already risen more in the first 15 days of April than they did over any full month in the previous ten years, something you can easily tell from the length of the green bar representing the current month..
The EIA's natural gas storage report for the week ending April 8th showed that the amount of working natural gas held in underground storage in the US rose by 15 billion cubic feet to 1,382 billion cubic feet by the end of the week, which still left our gas supplies 439 billion cubic feet, or 23.9% below the 1,836 billion cubic feet that were in storage on April 8th of last year, and 303 billion cubic feet, or 17.8% below the five-year average of 1,700 billion cubic feet of natural gas that have been in storage as of the 8th of April over the most recent five years....the 15 billion cubic foot injection into US natural gas working storage for the cited week was more than the average forecast for a 10 billion cubic foot injection from an S&P Global Platts survey of analysts, but it was less than the average injection of 33 billion cubic feet of natural gas that have typically been added to our natural gas storage during the same week over the past 5 years, and far kess than the 55 billion cubic feet that were added to natural gas storage during the corresponding week of 2021... assuming there will be no further withdrawals from storage until fall, the 1,382 billion cubic feet we ended this year's heating season with would have been the lowest natural gas inventory level since April 2019...
The Latest US Oil Supply and Disposition Data from the EIA
US oil data from the US Energy Information Administration for the week ending April 8th indicated that after a near record decrease in our oil exports, we were able to add surplus oil to our stored commercial crude supplies for the 7th time in 20 weeks and for the 16th time in the past forty-five weeks…our imports of crude oil fell by an average of 305,000 barrels per day to an average of 5,995,000 barrels per day, after rising by an average of 41,000 barrels per day during the prior week, while our exports of crude oil fell by an average of 1,513,000 barrels per day to 2,180,000 barrels per day during the week, after our exports had risen by an average of 705,000 barrels per day during the prior week...applying our oil exports to offset oil supplies from imports to get our effective trade in oil, we find there was a net import average of 3,815,000 barrels of per day during the week ending April 8th, 1,208,000 more barrels per day than the net of our imports minus our exports during the prior week…over the same period, production of crude oil from US wells was reportedly unchanged at 11,800,000 barrels per day, and hence our daily supply of oil from the net of our international trade in oil and from domestic well production appears to have totaled an average of 15,615,000 barrels per day during the cited reporting week…
Meanwhile, US oil refineries reported they were processing an average of 15,523,000 barrels of crude per day during the week ending April 8th, an average of 424,000 fewer barrels per day than the amount of oil than our refineries processed during the prior week, while over the same period the EIA’s surveys indicated that a net of 783,000 barrels of oil per day were being added to the supplies of oil stored in the US….so based on that reported & estimated data, this week’s crude oil figures from the EIA appear to indicate that our total working supply of oil from net imports and from oilfield production was 691,000 barrels per day less than what was added to storage plus what our oil refineries reported they used during the week…to account for that disparity between the apparent supply of oil and the apparent disposition of it, the EIA just inserted a (+691,000) barrel per day figure onto line 13 of the weekly U.S. Petroleum Balance Sheet in order to make the reported data for the daily supply of oil and for the consumption of it balance out, a fudge factor that they label in their footnotes as “unaccounted for crude oil”, thus suggesting there must have been an error or omission of that magnitude in this week’s oil supply & demand figures that we have just transcribed.... moreover, since last week’s EIA fudge factor was at (+1,352,000) barrels per day, that means there was a 661,000 barrel per day difference between this week's balance sheet error and the EIA's crude oil balance sheet error from a week ago, and hence the week over week supply and demand changes indicated by this week's report are completely useless....however, since most everyone treats these weekly EIA reports as gospel, and since these figures often drive oil pricing, and hence decisions to drill or complete oil wells, we’ll continue to report this data just as it's published, and just as it's watched & believed to be reasonably accurate by most everyone in the industry...(for more on how this weekly oil data is gathered, and the possible reasons for that “unaccounted for” oil, see this EIA explainer)….
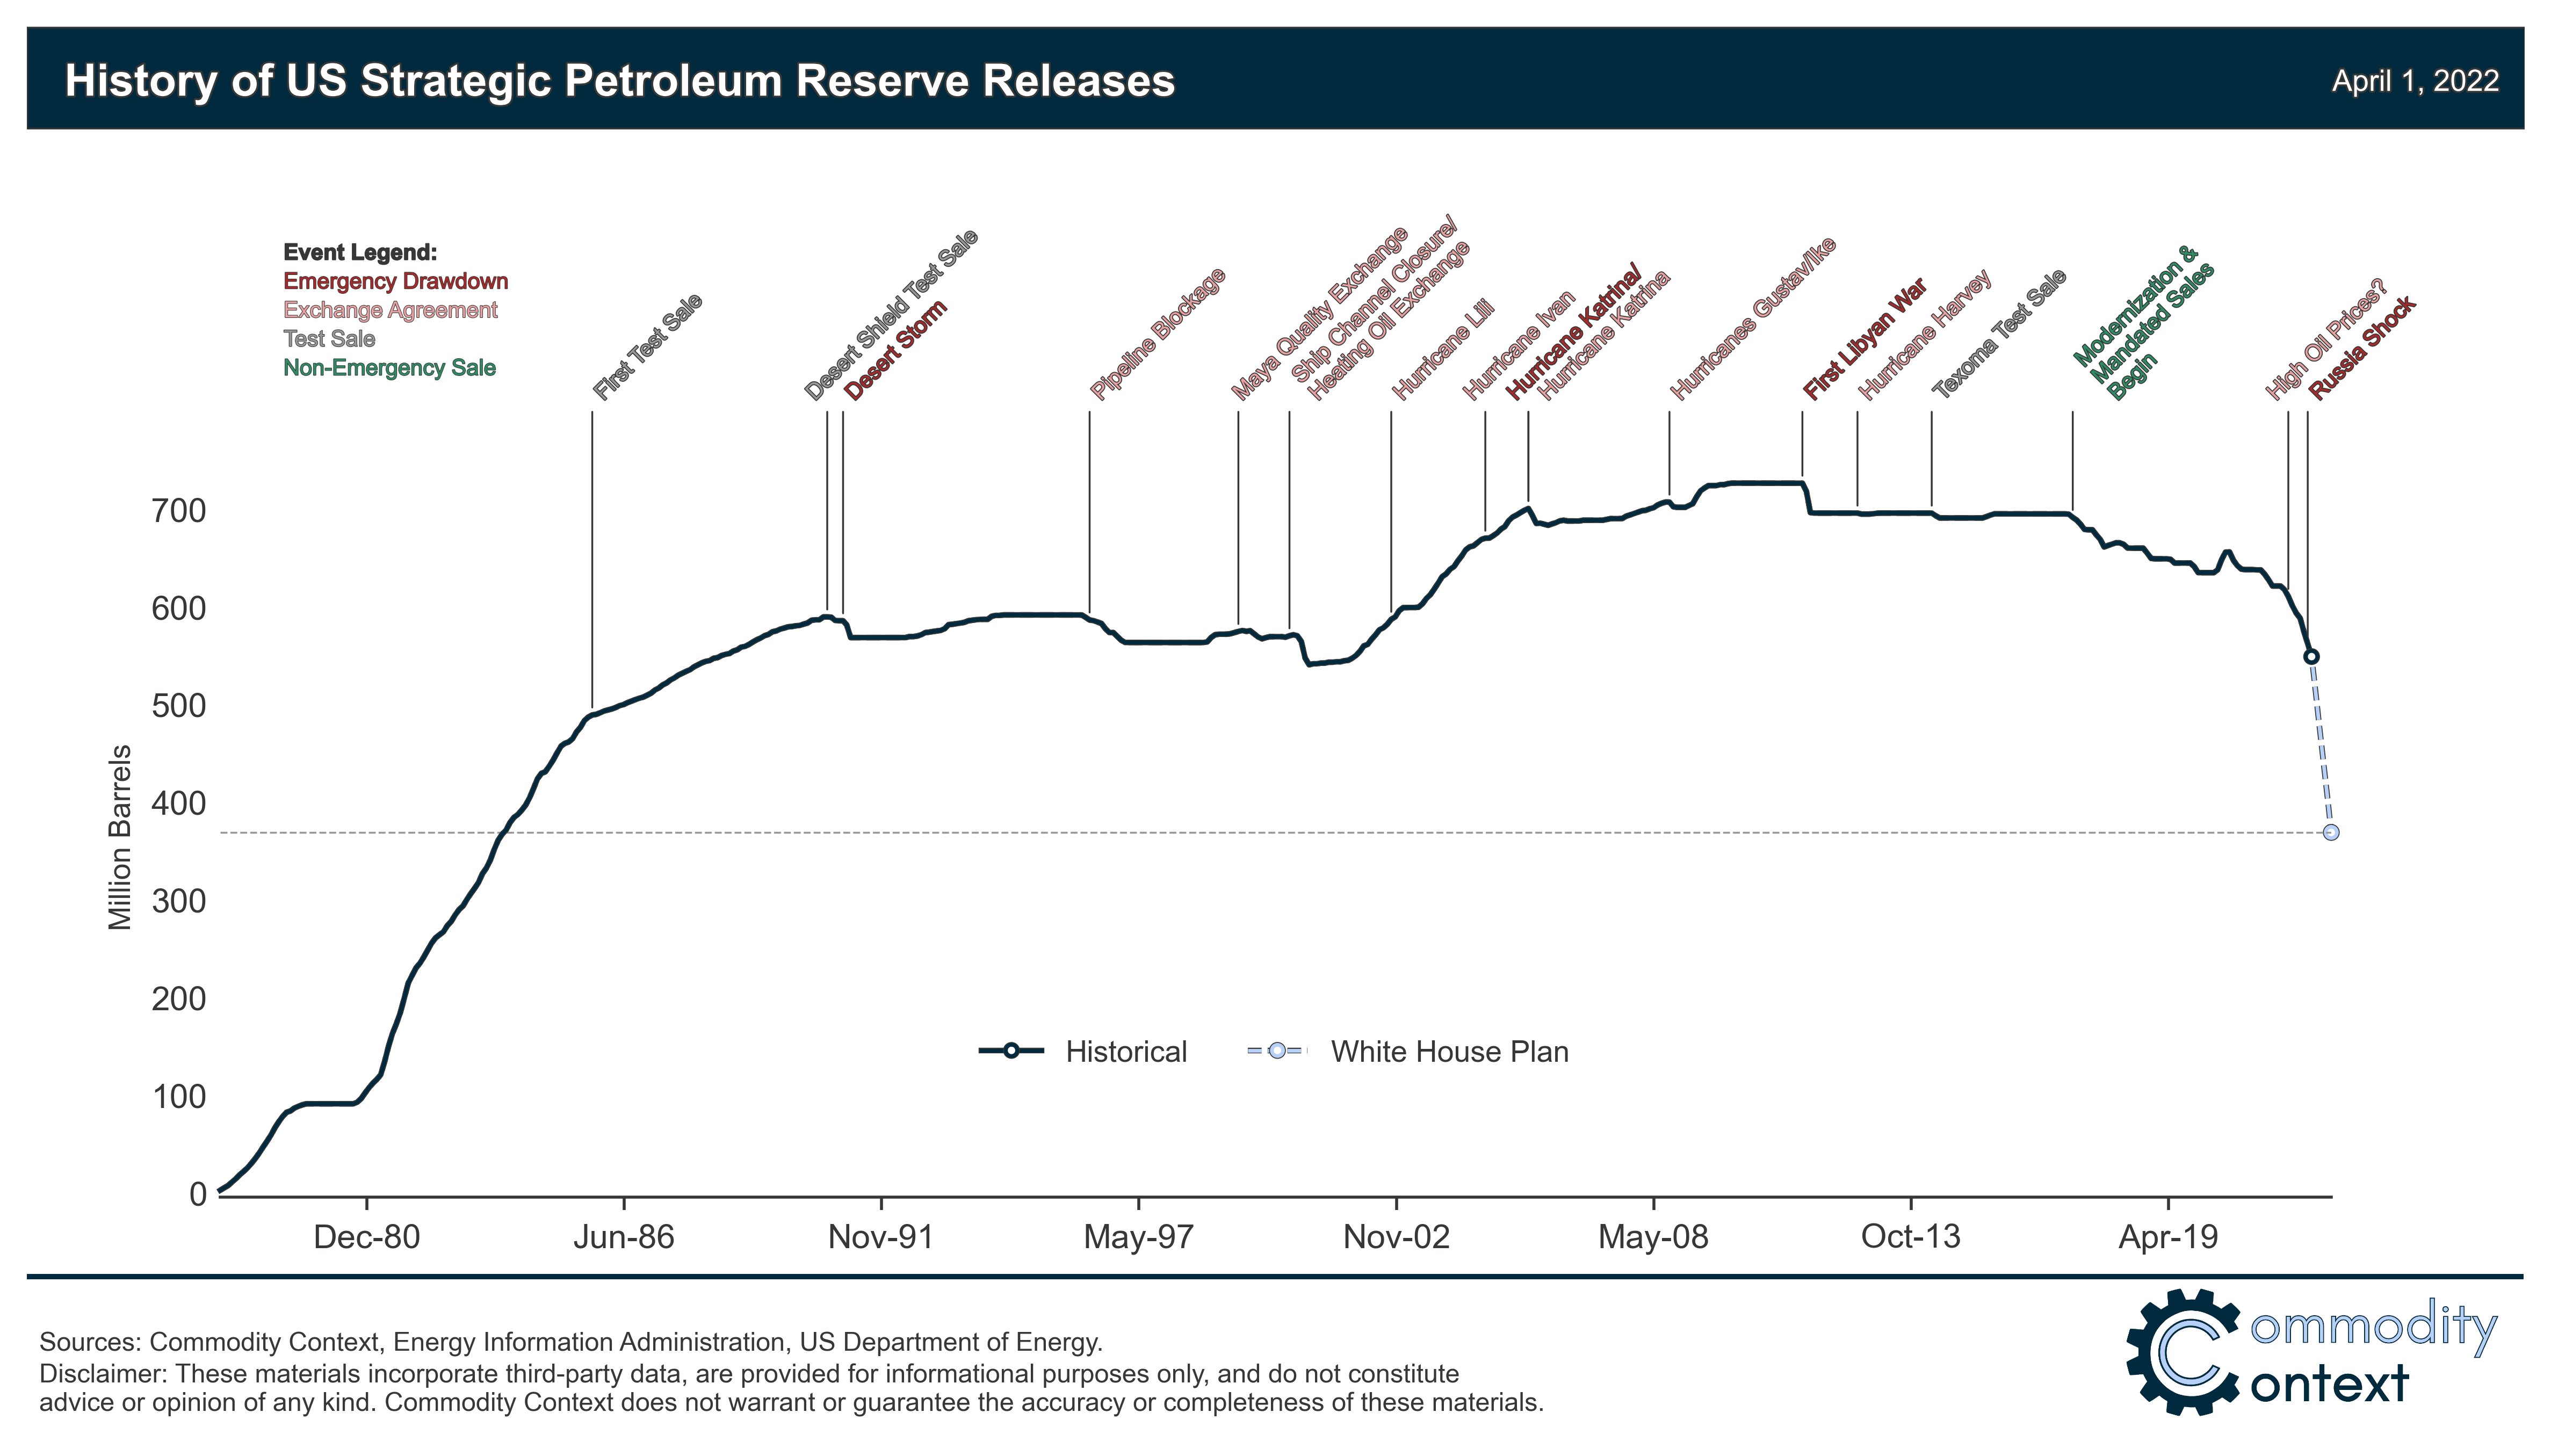
This week's 783,000 barrel per day increase in our overall crude oil inventories came as 1,340,000 barrels per day were being added to commercially available stocks of crude oil, while 557,000 barrels per day of oil were being pulled out of our Strategic Petroleum Reserve at the same time....that draw on the SPR included a withdrawal under the initial 30,000,000 million barrel release from the SPR to address Russian supply related shortfalls, as well as an earlier ongoing withdrawal under the administration's plan to release 50 million barrels from the SPR to incentivize US gasoline consumption....including other withdrawals from the Strategic Petroleum Reserve under similar recent programs, a total of 95,468,000 barrels have now been removed from the Strategic Petroleum Reserve over the past 21 months, and as a result the 560,681,000 barrels of oil still remaining in our Strategic Petroleum Reserve is now the lowest since March 8th, 2002, or at a 20 year low, as repeated tapping of our emergency supplies for non-emergencies or to pay for other programs has already drained those supplies considerably over the past dozen years...with Biden's recent announcement, an additional and unprecedented million barrels per day will be released from the SPR daily starting in May and running up to the midterm elections in November, in the hope of keeping gasoline and diesel prices lower up until that time....that total 180,000,000 barrel drawdown will remove almost a third of what remains in the SPR at this time, as the following graph illustrates...

The above graph comes from a post by oil and gas researcher Rory Johnston at Substack, wherein he discusses the implications of the planned SPR release, and it shows the historical quantity of oil held in our Strategic Petroleum Reserve, beginning from its inception following the Arab Oil Embargo of 1973-74 to the present day...the graph is further annotated to indicate the reasons for major additions to and withdrawals from the SPR, most of which were due to disruptions to oil supplies following hurricanes in the Gulf (you can get a better view of that by clicking on the graph, or even better yet, the enlarged version at substack.com....on the far right, Rory has projected where the strategic petroleum Reserve will end up after the Biden withdrawals are complete, which will take the SPR back to its level of 1983, while it was still being filled...based on an estimated average daily US oil consumption of 18,000,000 barrels per day, the US will have roughly 18 1/2 days of oil supply left in the Strategic Petroleum Reserve this November, after all three of the Biden administration's SPR withdrawal programs have run their course ...
Further details from the weekly Petroleum Status Report (pdf) indicate that the 4 week average of our oil imports fell to an average of 6,260,000 barrels per day last week, which was still 4.9% more than the 5,971,000 barrel per day average that we were importing over the same four-week period last year….this week’s crude oil production was reported to be unchanged at 11,800,000 barrels per day because the EIA's rounded estimate of the output from wells in the lower 48 states was unchanged at 11,400,000 barrels per day, while Alaska’s oil production fell by 5,000 barrels per day to 443,000 barrels per day but had no impact on the final rounded national total....US crude oil production had reached a pre-pandemic high of 13,100,000 barrels per day during the week ending March 13th 2020, so this week’s reported oil production figure was still 9.9% below that of our pre-pandemic production peak, but 40.0% above the interim low of 8,428,000 barrels per day that US oil production had fallen to during the last week of June of 2016...
US oil refineries were operating at 90.0% of their capacity while using those 15,523,000 barrels of crude per day during the week ending April 8th, down from the 92.1% utilization rate of the prior week, but still close to the historical utilization rate for early April refinery operations, when spring refinery maintenance programs have just about finished up…the 15,523,000 barrels per day of oil that were refined this week were 3.1% more barrels than the 15,051,000 barrels of crude that were being processed daily during week ending April 9th of 2021, when refineries were still recovering from winter storm Uri, and 22.6% more than the 12,665,000 barrels of crude that were being processed daily during the week ending April 10th, 2020, when US refineries were operating at what was then a much lower than normal 69.1% of capacity at the onset of the pandemic, but 3.5% less than the 16,078,000 barrels that were being refined during the week ending April 12th 2019, when refinery utilization had slipped to an 8 year low of 87.7% for the same week of April...
Even with the decrease in the amount of oil being refined this week, gasoline output from our refineries was still higher, increasing by 377,000 barrels per day to 9,501,000 barrels per day during the week ending April 8th, after our gasoline output had increased by 70,000 barrels per day over the prior week.…but this week’s gasoline production was still 1.2% less than the 9,615,000 barrels of gasoline that were being produced daily over the same week of last year, and 4.2% less than the gasoline production of 9,917,000 barrels per day during the week ending April 12th, 2019, ie, the year before the pandemic impacted output....on the other hand, our refineries’ production of distillate fuels (diesel fuel and heat oil) decreased by 388,000 barrels per day to 4,654,000 barrels per day, after our distillates output had decreased by 49,000 barrels per day over the prior week…even with those decreases, our distillates output was 10.1% more than the 4,228,000 barrels of distillates that were being produced daily during the week ending April 9th of 2021, but 3.5% less that the 5,038,000 barrels of distillates that were being produced daily during the week ending April 12th, 2019...
Even with the increase in our gasoline production, our supplies of gasoline in storage at the end of the week fell for the ninth time in ten weeks, decreasing by 3,648,000 barrels to 233,139,000 barrels during the week ending April 8th, after our gasoline inventories had decreased by 2,041,000 barrels over the prior week....our gasoline supplies decreased again this week because the amount of gasoline supplied to US users increased by 174,000 barrels per day to 8,736,000 barrels per day, and because our imports of gasoline fell by 45,000 barrels per day to 439,000 barrels per day while our exports of gasoline fell by 94,000 barrels per day to 886,000 barrels per day,.…and even with 9 inventory drawdowns over the past 10 weeks, our gasoline supplies were still only 0.7% lower than last April 9th's gasoline inventories of 234,897,000 barrels, and 3% below the five year average of our gasoline supplies for this time of the year…
Meanwhile, with this week's big decrease in our distillates production, our supplies of distillate fuels decreased for the tenth time in thirteen weeks and for the 22nd time in thirty-two weeks, falling by 2,902,000 barrels to an eight year low of 111,399,000 barrels during the week ending April 8th, after our distillates supplies had increased by 771,000 barrels during the prior week…our distillates supplies fell this week even though the amount of distillates supplied to US markets, an indicator of our domestic demand, fell by 163,000 barrels per day to 3,484,000 barrels per day, because our exports of distillates rose by 366,000 barrels per day to a 45 month high of 1,739,000 barrels per day, while our imports of distillates rose by 66,000 barrels per day to 154,000 barrels per day.....after thirty-six inventory decreases over the past fifty-two weeks, our distillate supplies at the end of the week were 22.3% below the 143,464,000 barrels of distillates that we had in storage on April 9th of 2021, and about 17% below the five year average of distillates inventories for this time of the year…
This week's spike in distillates exports, combined with elevated exports of other petroleum products, meant that our total exports of all such refinery products were at an all time high, rising from 5,938,000 barrels per day during the week ending April 1st to 6,807,000 barrels per day during the week ending April 8th, easily topping the prior export record of 6,432000 barrels per day set last August 6th; that record export total includes everything our refineries produce, from gasoline and distillates to kerosene type jet fuels, residual fuels, and propane/propylene...
Meanwhile, with the near record drop in our oil exports, our commercial supplies of crude oil in storage rose for the 14th time in 37 weeks and for the 20th time in the past year, increasing by 9,382,000 barrels over the week, from 412,371,000 barrels on April 1st to 421,753,000 barrels on April 8th, after our commercial crude supplies had increased by 2,421,000 barrels over the prior week…with this week’s increase, our commercial crude oil inventories were about 13% below the most recent five-year average of crude oil supplies for this time of year, but were nearly 30% above the average of our crude oil stocks as of the second weekend of April over the 5 years at the beginning of the past decade, with the disparity between those comparisons arising because it wasn’t until early 2015 that our oil inventories first topped 400 million barrels....since our crude oil inventories had jumped to record highs during the Covid lockdowns of spring 2020, and then jumped again after last year's winter storm Uri froze off Gulf Coast refining, our commercial crude oil supplies as of this April 8th were 14.4% less than the 492,423,000 barrels of oil we had in commercial storage on April 9th of 2021, and were also 16.3% less than the 503,618,000 barrels of oil that we had in storage on April 10th of 2020, and 7.3% less than the 455,154,000 barrels of oil we had in commercial storage on April 12th of 2019…
Finally, with our inventory of crude oil and our supplies of all products made from oil remaining near multi year lows, we are continuing to keep track of the total of all U.S. Stocks of Crude Oil and Petroleum Products, including those in the SPR....the EIA's data shows that the total of our oil and oil product inventories, including those in the Strategic Petroleum Reserve and those held by the oil industry, and thus including everything from gasoline and jet fuel to propane/propylene and residual fuel oil, rose by 3,465,000 barrels this week, from 1,708,416,000 barrels on April 1st to 1,711,881,000 barrels on April 8th, the second increase after our total supplies had decreased by 81,461,000 barrels over the first twelve weeks of this year...hence that increase still left our total supplies of oil & its products less than 5 million barrels higher than what would be an 8 year low dating back to April 4th, 2014.
OPEC's Report on Global Oil for March
Tuesday of the past week saw the release of OPEC's April Oil Market Report, which includes details on OPEC & global oil data for March, and hence it gives us a picture of the global oil supply & demand situation after OPEC and aligned oil producers agreed to increase their output by 400,000 barrels per day for an eighth consecutive month, ie from the previously agreed to July 2021 level, which was in turn part of the fifth production quota policy reset that they've made over the past twenty-two months, all in response to the pandemic-related slowdown and subsequent irregular recovery....note that now with the course and impact of the Ukraine war uncertain, we consider the demand projections made herein, which are only modestly lower than in the prior report, to be purely speculative, and hence will not address any projections beyond the March estimates..
The first table from this monthly report that we'll review is from the page numbered 45 of this month's report (pdf page 55), and it shows oil production in thousands of barrels per day for each of the current OPEC members over the recent years, quarters and months, as the column headings below indicate...for all their official production measurements, OPEC uses an average of production estimates by six "secondary sources", namely the International Energy Agency (IEA), the oil-pricing agencies Platts and Argus, the U.S. Energy Information Administration (EIA), the oil consultancy Cambridge Energy Research Associates (CERA) and the industry newsletter Petroleum Intelligence Weekly, as a means of impartially adjudicating whether their output quotas and production cuts are being met, to thereby avert any potential disputes that could arise if each member reported their own figures...

According to the agreement reached between OPEC and the other oil producers at their Ministerial Meeting on July 18th, 2021, the oil producers party to that agreement were to raise their output by a total of 400,000 barrels per day each month through December 2021, which was subsequently renewed to include further monthly 400,000 barrel per day production increases in January, February, March and April 2022, and which would indicate an increase of 254,000 barrels per day each month from the OPEC members listed above, with the rest supplied by other producers. including Russia..but as we can see from the above table, OPEC's increase of 57,000 barrels per day fell far short of that...the production decreases in Nigeria, which has ongoing pipeline theft and leakage problems, and Libya, with their repeated bouts of civil strife, are obviously part of the reason for the March shortfall, but even Saudi Arabia fell 50,000 barrels per day short of what they were expected to produce, as we'll see in the next table...

The adjacent table was originally included as a downloadable attachment to the press release following the 25th OPEC and non-OPEC Ministerial Meeting on February 2nd, 2022, which set OPEC's and other aligned producers production quotas for March... since war torn Libya and US sanctioned producers Iran and Venezuela are exempt from the production cuts imposed by the joint agreement that governs the output of the other OPEC producers, they are not shown here, and OPEC's quota is aggregated under the total listed for the 'OPEC 10', which you can see was to be at 25,061,000 barrels per day in March....therefore, the 24,240,000 barrels those 10 OPEC members actually produced in March were 821,000 barrels per day short of what they were expected to produce during the month, with Nigeria and Angola accounting for most of this month's shortfall, while only Kuwait and the UAE were able to produce what was expected of them.....
* * *
Recall that the original 2020 oil producer's agreement was to jointly cut their oil production by 23%, or by 9.7 million barrels per day, from an October 2018 baseline for just two months early in the pandemic, during May and June of 2020, but that initial 9.7 million bpd production cut agreement was extended to include July 2020 at a meeting between OPEC and other producers on June 6th, 2020....then, in a subsequent meeting in July of that year, OPEC and the other oil producers agreed to ease their deep supply cuts by 2 million barrels per day to 7.7 million barrels per day for August 2020 and subsequent months, which thus became the agreement that governed OPEC's output for the rest of 2020...the OPEC+ agreement for their January 2021 production, which was later extended to include February and March and then April's output, was to further ease their supply cuts by 500,000 barrels per day to a cut of 7.2 million barrels per day from that original 2018 baseline...then, during a difficult meeting on April 1st of last year, OPEC and the other oil producers that are aligned with them agreed to incrementally adjust their oil production higher each month by a pre-set amount for each country over the following three months, thus extending their joint output cut agreement through July....production levels for August and the following months of last year were to be determined by a July 1st OPEC meeting, but that meeting was adjourned on July 2nd due to a dispute between the UAE and the Saudis over the 2018 reference production levels, and a subsequent attempt to restart that meeting on July 5th was called off....so it wasn't until July 18th 2021 that a tentative compromise addressing August 2021's output quotas was worked out, allowing oil producers in aggregate to increase their production by 400,000 barrels per day in August, and again by that amount in each of the following months, and also to boost reference production levels for the UAE, the Saudis, Iraq and Kuwait beginning in April 2022....OPEC and other producers then agreed to increase their production in January 2022 by a further 400,000 barrels per day in a meeting concluded on the 2nd of December, 2021, and reaffirmed their intention to continue that policy with another 400,000 barrel per day increase in February at a meeting concluded January 4, 2022, and then agreed to stick to that 400,000 bpd oil output increase in March, despite pressure from the US to raise output more quickly, at a meeting on February 2nd....then, at a meeting on March 2nd, OPEC and its oil-producing allies, which included Russia, decided to hold their production increase at that level thru April in an OPEC+ meeting that only lasted 13 minutes, their shortest meeting ever...finally, on March 31, OPEC and aligned producers agreed to reaffirm the decisions of the prior Ministerial meetings and again limit their production increase to 400,000 barrels per day, because "the current [oil market] volatility is not caused by fundamentals, but by ongoing geopolitical developments"
Hence OPEC arrived at the production quotas for August 2021 through April of this year by repeatedly readjusting the original 23%, or 9.7 million barrel per day production cut from the October 2018 baseline that they first agreed to for May and June 2020, first to a 7.7 million barrel per day output reduction from the baseline for the remainder of 2020, then to a 7.2 million barrel per day production cut from the baseline for the first four months of this year, which was subsequently raised to an 8.2 million barrel per day oil output reduction after the Saudis unilaterally committed to cut their own production by a million barrels per day during the Covid surge of February, March, and then later during April of last year....under the agreement prior to the current one affecting this month, OPEC's production cut in April 2021 was set at 4,564,000 barrels per day below the October 2018 baseline, which was lowered to a cut of 3,650,000 barrels per day from the baseline with the prior comprehensive agreement, which thus set the July production quota for the "OPEC 10" at 23,033,000 barrels per day, with war torn Libya and US sanctioned producers Iran and Venezuela exempt from the production cuts imposed by thiat agreement....for OPEC and the other producers to increase their output by 400,000 barrels per day from that July 2021 level, each producer would be allowed to initially increase their production by just over 1% per month since that time...for OPEC alone, a 254,000 barrel per day increase each month since, begining with the July 2021 quota of 23,033,000 barrels per day, is how they arrived at the 25,061,000 barrels per day quota for OPEC for March that you see on the table above..
The next graphic from this month's report that we'll look at shows us both OPEC's and worldwide oil production monthly on the same graph, over the period from April 2020 to March 2022, and it comes from page 46 (pdf page 56) of OPEC's April Oil Market Report....on this graph, the cerulean blue bars represent OPEC's monthly oil production in millions of barrels per day as shown on the left scale, while the purple graph represents global oil production in millions of barrels per day, with the metrics for global output shown on the right scale....

Including this month's 57,000 barrel per day increase in OPEC's production from their revised production of a month earlier, OPEC's preliminary estimate is that total global liquids production increased by a rounded 370,000 barrels per day to average 99.66 million barrels per day in March, a reported increase which came after February's total global output figure was apparently revised down by 210,000 barrels per day from the 99.50 million barrels per day of global oil output that was estimated for February a month ago, as non-OPEC oil production rose by a rounded 320,000 barrels per day in March after that downward revision, with 260,000 barrels per day of the increase coming from the US and Norway, due to the resolution of weather related outages and a shale oil production increase in March...
After that increase in March's global output, the 99.66 million barrels of oil per day that were produced globally during the month were 6.45 million barrels per day, or 6.9% more than the revised 93.21 million barrels of oil per day that were being produced globally in March a year ago, which was the third month that OPEC and their allied producers had reduced their output cuts by 500,000 barrels per day from the 7.7 million barrels per day production cut that they applied to the last 5 months of 2020, but also the second month that the Saudis had unilaterally decreased their own production by a million barrels per day in response to the pandemic's hit to demand (see the April 2021 OPEC report (online pdf) for the originally reported March 2021 details)...with this month's modest increase in OPEC's output, their March oil production of 28,557,000 barrels per day amounted to 28.7% of what was produced globally during the month, down from their revised 28.8% share of the global total in February....OPEC's March 2021 production was reported at 25,042,000 barrels per day, which means that the 13 OPEC members who were part of OPEC last year produced 3,515,000 barrels per day, or 14.0% more barrels per day of oil this March than what they produced a year earlier, when they accounted for 26.9% of global output...
After the increases in OPEC's and global oil output that we've seen in this report, the amount of oil being produced globally during the month was a bit more than the expected global demand, as this next table from the OPEC report will show us....

The above table came from page 26 of the April Oil Market Report (pdf page 36), and it shows regional and total oil demand estimates in millions of barrels per day for 2021 in the first column, and then OPEC's estimate of oil demand by region and globally quarterly over 2022 over the rest of the table...on the "Total world" line in the second column, we've circled in blue the figure that's relevant for March, which is their estimate of global oil demand during the first quarter of 2022....OPEC is estimating that during the 1st quarter of this year, all oil consuming regions of the globe were using an average of 98.95 million barrels of oil per day, which is a downward revision of 19,000 barrels per day from their estimate for 1st quarter demand of a month ago (that revision is circled in green)...but as OPEC showed us in the oil supply section of this report and the summary supply graph above, OPEC and the rest of the world's oil producers were producing 99.66 million barrels million barrels per day during March, which would imply that there was a surplus of around 710,000 barrels per day of global oil production in March, when compared to the demand estimated for the month...
In addition to figuring the March global oil supply shortfall that's evident in this report, the downward revision of 210,000 barrels per day to February's global oil output that's implied in this report, which is mostly offset the 190,000 barrels per day downward revision to first quarter demand noted above, means that the 360,000 barrels per day global oil output surplus we had previously figured for February would now be revised to a surplus of 340,000 barrels per day...similarly, the oil shortage of 600,000 barrels per day we had previously figured for January would be revised to a shortage of 410,000 barrels per day in light of the 190,000 barrel per day downward revision to first quarter demand...
Also note that in orange we've also circled an upward revision of 70,000 barrels per day to 2021's demand, which also means that the supply shortfalls that we previously reported for last year would have to be revised....a separate table on page 25 of the March Oil Market Report (pdf page 35) indicates the revisions to 2021 demand included an an upward revision of 20,000 barrels per day to 4th quarter demand, an upward revision of 90,000 barrels per day to 3rd quarter demand, an upward revision of 80,000 barrels per day to 2nd quarter demand. and an upward revision of 140,000 barrels per day to 1st quarter demand...we're not inclined to go back and recompute the shortages for each month of 2021, but we do have adequate totals for the year from our prior reports such that we can estimate an aggregate revision...
With the release of OPEC's January Oil Market Report three months ago, we had complete and revised data for all of 2021, and found that the world was short 527,910,000 barrels of oil during the year, which worked out to a shortage of 1,446,300 barrels of oil per day....OPEC's February Oil Market Report then revised aggregate global demand for 2021 higher by 10,000 barrels per day, OPEC's March Oil Market Report revised 2021 demand higher by 90,000 barrels per day, and now this month's report has revised that demand higher by another 70,000 barrels per day....that means our original estimate of 2021's oil shortage now needs to be revised a total 170,000 barrels per day higher, or to 1,616,300 barrels per day...that would therefore revise the total shortage total shortage of oil for last year up to 534,115,000 barrels....we're still far from running out, however, because the quantities of oil being produced globally during the pandemic of 2020 still averaged over 1.1 trillion barrels, or over 3 million barrels per day more than anyone wanted...
This Week's Rig Count
The number of drilling rigs running in the US rose for the 69th time over the prior 81 weeks during the period ending April 14th, but it still remained 12.6% below the prepandemic rig count (note that this week's tally only counts 6 days due to Good Friday)......Baker Hughes reported that the total count of rotary rigs drilling in the US increased by four to 693 rigs this past week, which was also 254 more rigs than the pandemic hit 439 rigs that were in use as of the April 16th report of 2021, but was still 1,236 fewer rigs than the shale era high of 1,929 drilling rigs that were deployed on November 21st of 2014, a week before OPEC began to flood the global market with oil in an attempt to put US shale out of business….
The number of rigs drilling for oil was up by 2 to 548 oil rigs during this week, after rigs targeting oil had increased by 13 during the prior week, and there are now 204 more oil rigs active now than were running a year ago, even as they still amount to just 34.1% of the shale era high of 1609 rigs that were drilling for oil on October 10th, 2014, and as they are still down 19.8% from the prepandemic oil rig count….meanwhile, the number of drilling rigs targeting natural gas bearing formations was up by 2 to 143 natural gas rigs, the most since October 11th, 2019, and up by 49 natural gas rigs from the 94 natural gas rigs that were drilling during the same week a year ago, even as they were still only 8.9% of the modern high of 1,606 rigs targeting natural gas that were deployed on September 7th, 2008…in addition to rigs targeting oil and gas, Baker Hughes continues to show two active "miscellaneous" rigs; one is a rig drilling vertically for a well or wells intended to store CO2 emissions in Mercer county North Dakota, and the other is also a vertical rig, drilling 5,000 to 10,000 feet into a formation in Humboldt county Nevada that Baker Hughes doesn't track...
The offshore rig count in the Gulf of Mexico was unchanged at twelve offshore rigs this week, with all of this week's Gulf rigs drilling for oil in Louisiana waters....that's the same number of offshore rigs that were active in the Gulf a year ago, when ten Gulf rigs were drilling for oil offshore from Louisiana and two were deployed for oil in Texas waters…since there is not any drilling off our other coasts at this time, nor was there a year ago, those Gulf of Mexico rig counts are equal to the national offshore totals for both years....
In addition to those rigs offshore, we continue to have a water based directional rig, drilling for oil at a depth of over 15,000 feet, inland in the Galveston Bay area, while during the same week of a year ago, there were no such "inland waters" rigs deployed..
The count of active horizontal drilling rigs was up by 5 to 636 horizontal rigs this week, which was also 238 more rigs than the 398 horizontal rigs that were in use in the US on April 16th of last year, but still 53.7% less than the record 1,374 horizontal rigs that were drilling on November 21st of 2014....on the other hand, the vertical rig count was down by one to 26 vertical rigs this week, while those were still up by 4 from the 21 vertical rigs that were operating during the same week a year ago…meanwhile, the directional rig count was unchanged at 32 directional rigs this week, and those were still up by 12 from the 20 directional rig that were in use on April 16th of 2021….
The details on this week’s changes in drilling activity by state and by major shale basin are shown in our screenshot below of that part of the rig count summary pdf from Baker Hughes that gives us those changes…the first table below shows weekly and year over year rig count changes for the major oil & gas producing states, and the table below that shows the weekly and year over year rig count changes for the major US geological oil and gas basins…in both tables, the first column shows the active rig count as of April 14th, the second column shows the change in the number of working rigs between last week’s count (April 8th) and this week’s ( April 14th) count, the third column shows last week’s April 8th active rig count, the 4th column shows the change between the number of rigs running on Friday and the number running on the Friday before the same weekend of a year ago, and the 5th column shows the number of rigs that were drilling at the end of that reporting week a year ago, which in this week’s case was the 16th of April, 2021...

We'll again start by checking the Rigs by State file at Baker Hughes for the Texas changes in the Permian basin...there we find that three rigs were added to those in Texas Oil District 8, which encompasses the core Permian Delaware, and that two more rigs started drilling in Texas Oil District 8A, which includes the Texas counties in the northern part of the Permian Midland, but that two rigs were removed from Texas Oil District 7C, which encompasses those Texas counties in the southern part of the Permian Midland, at the same time, thus indicating a net increase of three rigs in the Texas Permian...since there was just a two rig increase in the Permian basin nationally, that means that the rig that was pulled out from New Mexico had been drilling in the western Permian Delaware in the southeast corner of that state,...
Elsewhere in Texas, we find that a rig was added in Texas Oil District 2, but that a rig was pulled out of Texas Oil District 3, in the only evidence of activity in the Eagle Ford districts (1 thru 4) in that state...but since the Eagle Ford shale rig count was up by three oil rigs, that means there were at least two other rigs pulled out of those four districts targeting other basins that Baker Hughes doesn't track, to offset and thus mask evidence of those Eagle Ford increases...the North America Rotary Rig Count Pivot Table (XLS) provides county level details, should you want to know exactly what those changes were... meanwhile, another rig was added in Texas Oil District 5, which accounts for the natural gas rig increase in the Barnett Shale near Dallas-FtWorth...
In other rig changes around the country, there was an oil rig added to Oklahoma's Cana Woodford, and an oil rig increase on Alaska's North Slope (as indicated by the Pivot Table), while the inland waters rig that had been targeting oil at a depth of between 10,000 and 15,000 feet in St. Mary Parish, Louisiana was removed...for rigs targeting natural gas formations, there was a natural gas rig addition in the Haynesville shale, offset by the removal of a Haynesville shale oil rig, thus netting no net change in the Haynesville count, while at the same time two rigs targeting natural gas were added in West Virginia's Marcellus, which were offset by the removal of two natural gas rigs from Pennsylvania's Marcellus, thus also netting no net change in the Marcellus...
+++++++++++++++++++++++++++++++++++++++++
Canfield fire chief, officials discuss concerns over plans to build school near ethane pipeline --- There's a pipeline that's been running through parts of the Valley for eight years, but now some parents and residents in Canfield are now sharing their concerns about the pipeline after Canfield Local School District's announcement to build its new K-8 school compound on a property that contains an eight-inch Highly Volatile Liquid (HVL) pipeline. The transmission line runs across the former 300-acre Red Gate Farm at the corner of Leffingwell and Palmyra Roads, which was annexed into the city of Canfield in 2017. This location for the proposed school site was recently announced as part of a development agreement that provided the district with 100 acres for the new school compound. The concern from residents is based on what flows through the pipeline – ethane – a colorless, odorless gas that is used in the making of plastics. According to the Chemical Safety Information from the World Health Organization, ethane is listed as a highly volatile liquid and an extremely flammable gas, which if released, can displace oxygen, can produce a vapor cloud, and large fireball combustion. Ethane is listed as a hazardous substance by the U.S. Department of Transportation, American Conference of Governmental Industrial Hygienists, and National Fire Protection Association, which rates substances as fire and/or explosive hazards.The pipeline is part of the Mariner West pipeline, a 400-mile ethane pipeline that starts near Pittsburgh and runs through part of Columbiana County and across Mahoning County and continues on to Ontario.In February, the Canfield Local School District shared its vision for the location of the K-8 compound with the public, which shows the proposed building approximately 200 feet from the existing Mariner West pipeline. On April 5, Canfield Fire Chief Don Hutchinson sent a letter to Canfield Local Schools Superintendent Joe Knoll, after speaking with the US. Department of Transportation, the federal agency that regulates pipelines in the U.S. In the letter, Hutchinson wrote “my review of the regulations suggest that placement of the school and related facilities would be in a 'high consequence area' and … “The proposed placement of the school facilities has raised a significant safety concern for me, as it should for the school administration.”According to Chief Hutchinson, he has been speaking with the operator of the ethane pipeline that runs through Canfield and the township and said an immediate evacuation for “an isolated leak is 330 feet in all directions” would be needed, which coincides with the DOT Office of Pipeline Safety distance for High Consequence Areas, based on product and size piping and the pounds per square inch for 300 feet. Richard Kuprewicz, president of Accufacts, Inc. out of Redmond, WA., specializes in investigations on pipelines for safety, construction, and risk management, recommends an evacuation radius of at least a half-mile, or 2,640 feet if a vapor cloud were to form from a leak, crack or rupture. Kuprewicz said an 8-inch ethane pipeline leak could cause damage to nearby buildings, but rupture would be more destructive.Canfield Local Schools Superintendent Joe Knoll said that the Canfield Local Board of Education and his office have been spending the last few months reviewing pipeline data and having discussions with the pipeline operator and the local fire department. “There are a lot of safety measures that the pipeline operators have in place,” Knoll said, “Which is good for us in a school setting.”
Oil and gas production expected to increase in Guernsey County - Industry experts expect to see an increase in oil and gas production in the Utica Shale region including Guernsey County this year due to a rising demand resulting from global issues and domestic usage. Guernsey County currently has 300 Utica shale well permits and the most active producers in the county are Ascent Resources with 130 permits, Southwestern Energy with 69 and Utica Resources with 31. The Ohio Department of Natural Resources reports 24 wells — 23 productive and 1 exploratory — were drilled in Guernsey County in 2019, the latest year for which statistics are available. The average well depth was 19,918 feet with an estimated footage drilled of 478,029. The most recent horizontal shale production statistics for Guernsey County from 2019 totaled 13,556,178 barrels of oil and 91,078,704 Mcf of gas. "The industry in Guernsey County is strong, and it's active," said Mike Chadsey of the Ohio Oil & Gas Association after a recent roundtable discussion attended by Ohio Secretary of State Frank LaRose at the Cambridge Country Club. "It's because what's happening globally. "Some of the opportunities and challenges happening right now are allowing us to put (drilling) units together...get leases together and go out and drill to lift that commodity out of the ground. You will see increased activity here in Guernsey County this year, and beyond this year." There are 12 drilling rigs currently in operation in the Utica region across southeast Ohio. According to the Ohio Department of Natural Resources, more than 275,000 gas wells had been drilled statewide as of 2019 with 2.6 trillion cubic feet of natural gas production. The most recent statistics available also show 55,921 oil wells have produced 27 million barrels of crude oil. "I think it's strong," said LaRose of Ohio's oil and gas industry "Ohio has done smart things to be a welcoming state when it comes to energy, and there's good reason for that. All you need to do is look to Europe right now." "Shutting off Russia's oil supply, you are going to have to make that up somewhere and that's where you are seeing some renewed interest in the western part of the Utica shale formation because it's more rich in oil deposits," said George Brown of OOGEEP. "The great thing about Guernsey County is the entire natural gas ecosystem that goes along with it (oil)." Ohio is home to four oil refineries, which can produce nearly 600,000 barrels of crude oil daily, according to the Ohio Oil & Gas Energy Education Program. That's enough oil to produce 11.4 millions gallons of gasoline per day. The rate at which oil and gas production will increase in Guernsey County this year will depend on several variables, according to local officials. "It will probably depended producer to producer based on what their plans are...their access to capital and what their drilling units look like, but I would say we will see increased activity this year," said Chadsey. "Our people can't turn on a dime. You do have to get a permit, get your hands on a rig, a crew and all that stuff, so it will probably be a slow ramp up but I think we will continue to see more activity and excitement about that activity here in Guernsey County." The county continues to be on the western edge of the Utica shale play in what is referred to as the oil window. Brown said there are two-overlaying issues that will slow production in Guernsey and other counties nearby when it come to oil and gas. "One is the certainty in the planning that needs to go into the preparation process for exploration," he said. "It takes time. It can take up to a year, if not more, to get a rig in place and get it in the process of exploration. An atmosphere that is more encouraging of domestic, made in Ohio energy is important. "And two, building out the critical energy infrastructure to get that product to meet its market. There are currently five pipeline proposals that have either been canceled or opposed that would haven taken the gas and oil coming from Ohio and other parts of the basin to end users either on the east coast of the United State or down south to meet the needs.
One Less Way for Ohio Landowners to Challenge Royalty Severances - The National Law Review - On February 15, 2022, the Ohio Supreme Court issued a significant decision in Peppertree Farms, L.L.C. v. Thonen establishing that, unless expressly stated otherwise, an oil and gas royalty interest retained in a deed executed prior to 1925 is not limited to the lifetime of the grantor. In so holding, the Ohio Supreme Court cut off one of the only grounds, other than the Dormant Minerals Act and Marketable Title Act, for landowners to quiet title and eliminate past oil and gas severances. Ohio follows a legal tradition under which the default rules of English “common law” were adopted and then adapted by statute to form the basis of our legal system. At common law, a conveyance of real property had to include “words of inheritance” (i.e., an express statement that the royalty interest would last in perpetuity and be inheritable) or the interest being conveyed would be limited to the lifetime of the grantee (a life estate). Additional complications arose when a grantor sought to retain an interest by deed. If the grantor was retaining a right which had already been conveyed to him in perpetuity, then the retention qualified as a “technical exception” of a pre-existing right and additional words of inheritance were not required. However, if the grantor was creating and then retaining a new right, the retention qualified as a “technical reservation” and was limited to a life estate. As new modes of production and corresponding property rights were discovered, it became unclear exactly what rights pre-existed a severance and the whole system of distinctions fell apart. In 1925, the General Assembly passed a law establishing that all future conveyances of real property were presumed perpetual unless stated otherwise. While eliminating this issue as to future deeds, the General Assembly did not settle the issue as to deeds executed before 1925 or clarify whether the retention of an oil and gas royalty was a “technical exception” or “technical reservation.” In the Peppertree Farms case, Plaintiffs Peppertree Farms, Jay Moore and Amy Moore (collectively, “Peppertree”) sought to quiet title to certain lands in Monroe County, Ohio, against a severed oil and gas royalty interest (the “Royalty Interest”) originally retained by the grantor under a 1921 deed. In addition to a claim for extinguished under Ohio’s Marketable Title Act, Peppertree asserted that the Royalty Interest did not include words of inheritance and was therefore a newly created right which terminated upon the death of the grantor under the 1921 deed. Conversely, the defendant royalty owners (“Royalty Owners”) argued that the Royalty Interest was a pre-existing right which the grantor already held, and therefore could retain, in perpetuity without words of inheritance. While Peppertree was able to convince both the trial and appellate court that the Royalty Interest was a newly created interest which was limited to a life estate, it was unsuccessful with the Ohio Supreme Court. Reasoning that a royalty was nothing more than the retention of part of the right to receive the proceeds of oil and gas production, the Court ultimately found that the Royalty Interest was a “technical exception” which survived the lifetime of the grantor. As a result, Peppertree was limited to its claims for extinguishment under the Marketable Title Act and Ohio surface owners lost another means to challenge ancient royalty reservations.
Fighting Off A Petrochemical Future in the Ohio River Valley - - It was 2007, and the fracking industry was just beginning to take hold in southwest Pennsylvania. The then-fledgling industry was not really on Vanessa Lynch’s radar; between raising a daughter and working full-time as a therapist, she had her hands full. Things got even busier when she had her son in April 2009 and he began suffering from frightening wheezing spells when he was 6 months old, requiring periodic medical attention. “Honestly, I really had very little understanding of what was going on in the region,” she says.Just before her daughter was set to start kindergarten, Lynch and her family moved half an hour away to Indiana Township to be close to a good school and have more space to play outside. The neighborhood had everything the growing family could hope for, with a park to play soccer and softball and a creek for summertime wading.A couple of years later, however, she learned via a neighbor’s Facebook post that the fracking industry had quietly placed a gas drilling site in her community, just above the local park. Infuriated and inspired to act, in 2018, Lynch joined up with the local chapter of the national environmental advocacy group Moms Clean Air Force, where she now works as a part-time organizer.Lynch and her fellow organizers were not able to shut down the well pad, but they did win more protective ordinances for the township, shielding approximately 85% of its land from future drilling.Now, though, there’s another threat lurking at Lynch’s door: a plastics manufacturing plant that Shell Oil is constructing just an hour away, on the banks of the Ohio River.Shell’s ethane-cracker plant, which it began building in 2017, is set to open later this year, but the company has not yet announced a firm date and did not respond to a request for comment. The first facility of its kind in Appalachia, it will use extreme heat to “crack” ethane, a byproduct of fracked gas, into ethylene, a building block for manufacturing plastic.The facility will produce more than 1 million tons of plastic pellets per year, which will be used to make products ranging from phone cases to auto parts. As it does, the facility will spew hundreds of tons of dangerous compounds into the air while also emitting planet-heating pollution. And it will be fed by the fracked gas from thousands of wells peppered across Appalachian communities—communities like Lynch’s.
Amid Hopes and Fears, a Plastics Boom in Appalachia Is On Hold - Yale E360 - Retired and newly married, Karen Gdula was asleep when, just before 5 a.m., an explosion shook her rural western Pennsylvania home. The roar was so loud that some of her neighbors thought it was a plane crash. But when she and her husband saw a fireball stretching above the tops of the towering pine trees across the street, they knew exactly what had happened. The Revolution Pipeline, running right behind Ivy Lane in Center Township, about 25 miles northwest of Pittsburgh, had come into service only days before, carrying gas from the fracking wells that are everywhere in the region. No one was hurt, but the explosion flattened a home three doors down from Gdula’s and toppled six giant electrical transmission towers. Now, Revolution is back in service, and another pipeline has come to Ivy Lane, too. It’s called Line N, and it feeds gas to the vast, $6 billion petrochemical plant Shell is building five miles away in Monaca, right on the Ohio River. That plant, called an “ethane cracker,” will soon turn ethane — a byproduct of fracking — into 1.6 million tons of raw plastic a year.Five years ago, the flood of ethane coming from the Ohio River Valley’s fracking wells got the plastic industry — petrochemical firms that are often subsidiaries of big fossil fuel producers — dreaming about a new generation of massive plants in the region. Companies envisioned building as many as four more ethane crackers like Shell’s in Appalachia, and state and local officials from both parties embraced the idea.That vision is now foundering. Obstacles including global overproduction of plastic, local opposition to pipelines that feed such facilities, and public concern about the tidal wave of waste choking oceans and landscapes mean that even the region’s second proposed ethane cracker may never materialize. Additional plants look even less likely. The question mark over the industry’s once-grand hopes for Appalachia reflects larger doubts about its plans for dramatically Driving oil and gas companies’ plastic production ambitions is the understanding that action on climate change may soon reduce demand for their fuels. Plastic is central to their hopes of keeping profits flowing, so they’ve been pouring money into building new plants and expanding old ones, on track to double 2016 global plastic production levels by 2036. Fracking has made the United States a major player in this international buildout. The American Chemistry Council, an industry association, says companies are investing more than $200 billion in U.S. chemical projects using fracked ingredients. Most of that growth has happened on the Gulf Coast, the country’s long-standing petrochemical hub.
Gas company to explore State Game Lands in Tioga County — The Pennsylvania Board of Game Commissioners recently approved an agreement that will allow a Texas-based energy company to develop oil and gas interests on State Game Lands in Tioga County.The agreement between the Game Commission and Seneca Resources Company will result in a $730,500 bonus payment, and royalties paid to the commission over the 10-year term of the agreement. That money will be added to the Game Fund, the commission says.Seneca Resources will explore about 409 acres of State Game Lands 313 in Delmar and Chatham townships, according to the agreement.The main tract is located in Delmar Township, less than three miles northwest of Wellsboro. The second tract is just north of Little Marsh. The third tract lies between US 6 and and Marsh Creek.Although the gamelands is in a mostly rural setting, it's right next to a railroad that supplies the local natural gas industry, according to the Game Commission.Seneca Resources, which has an eastern division based in Pittsburgh, operates approximately 900 deep, unconventional Marcellus and Uitca shale wells in Pennsylvania
Public health in Pennsylvania ignored during fracking rush: Report - In a rush to reap the economic benefits of fracking, the Pennsylvania Department of Health (DOH), the state General Assembly and three governors ignored or gave underwhelming responses to public health concerns, according to a new white paperfrom the nonprofit Environmental Health Project.“[I]t is clear that, to date, many members of the General Assembly, the Governor’s Office, and the DOH have failed to make a good faith effort to understand and address the health risks and resulting health impacts of shale gas development,” the paper, entitled "Pennsylvania's Shale Gas Boom: How Policy Decisions Failed to Protect Public Health and What We Can Do to Correct It," states.Environmental Health Project, a health organization focused on how shale gas drilling and its byproducts impact communities, collected health data from Pennsylvania residents living near shale wells, which now number more than 13,000 in permits, to make up for what it describes as inaction by the state.“Since we have been doing this for 10 years, it seemed like time to reflect on the comprehensive narrative on how we got to where we are today,” said EHP Executive Director Alison L. Steele.Research has linked increased risk of infant mortality, low birth rates, depression, and hospitalizations for skin and urinary issues to live near fracking wells. The findings come a year after Environmental Health News’ “Fractured” investigation, which found that Western Pennsylvania families near fracking are exposed to harmful chemicals, and regulations fail to protect communities' mental, physical, and social health. The report traces much of the systematic neglect to Act 13, passed in 2012 under Republican Gov. Tom Corbett. The law established some fundamentals for shale drilling in Pennsylvania. It enabled the state to preempt some local environmental laws and zoning authority in order to establish uniform statewide standards for shale gas well development. Act 13 also created the “impact fee,” an annual per-well fee paid by the operator. Pennsylvania is the only state to tax drill operators in this way; the 33 other oil producing states tax profits. While the fees generated about $150 million to $200 million a year, the report states that, “It has been estimated that a severance tax, either instead of or in addition to an impact fee, would have provided the state with billions of dollars in revenue over the first decade of the shale boom.”
Dr. Oz's First-Class Flip-Flop On Fracking - Mehmet Oz, the celebrity TV surgeon better known as Dr. Oz, used to write and tweet about the health benefits ofcoconut oil,lavender oil,CBD oil,MCT oil, avocado and olive oil.He also appeared to be a strong opponent of fracking, warning his readersinmultiplearticles about the potential health risks associated with one of the more controversial fossil fuel extracting technologies.Hydraulic fracturing, better known as “fracking,” involves pumping a pressurized mixture of water, sand and chemicals into underground rock formations to release oil and natural gas.In 2014, an Ohio man asked Oz and Dr. Mike Roizen, then the chief medical officer at the Cleveland Clinic Wellness Institute, whether it was true that fracking is polluting air and groundwater and threatening public health.Oz and Roizen replied that it was “a fact” that the process pumps “toxic chemicals” deep into the ground.“We wonder how eager the leaders of the natural gas industry would be to drink well water from a farm next to one of their drilling sites,” Oz and Roizen wrote in ahealth and wellnessQ&A, adding that in Pennsylvania, “there are multiple reports of air and water contamination, possibly from hydraulic fracturing sites, causing folks breathing problems, rashes, headaches, nosebleeds, numbness, nausea and vomiting.”But now that Oz is a GOP Senate candidate in Pennsylvania, he is apparently less concerned about fracking’s possible health effects on his potential constituents and more interested in preserving an industry active in the state.“Back off Biden! Give us freedom to frack!” Oz said Wednesday in a rambling TikTokvideo while pumping gas somewhere in the Keystone State.
The climate war we cannot afford to lose - Martins Ferry Times Leader - Dear Editor, Dr. Svitlana Krakovska, a Ukrainian climate scientist and member of the International Panel on Climate Change recently said, “Human induced climate change and the war on Ukraine have the same roots, fossil fuels, and our dependence on them,” Europe’s dependence on fossil fuels from Russia is “funding the war” in Ukraine. Russia, the second largest producer of natural gas, has been accused of using the resource in a geopolitical way against European countries dependent on its gas. Europe views the worsening situation in Ukraine as justification to double up its investments in renewable energy and cut Europe’s demand for natural gas. The IEA and EU leaders want to fast-track permitting for wind and solar projects, revisit decisions to phase out nuclear energy, and double the rate of conversions from natural gas boilers to electric heat pumps in buildings.”However, oil and gas companies in the U.S., along with many politicians including Joe Manchin of West Virginia and Bill Johnson of CD 6 Ohio, are using the war to rationalize more drilling and fracking in the U.S., basically, ignoring the real war at our doorstep; the war for a livable planet. Natural Resource Chair Raul Grijalva (D-Arizona) said in a recent op-ed, “Doubling down on fossil fuels is a false solution that only perpetuates the problems that got us here in the first place.”The newly released UN Climate Report clearly shows we are losing the battle against climate change. UN Secretary General Antonio Gutteras said “the evidence detailed by the Intergovernmental Panel on Climate Change is unlike anything he has ever seen, an “atlas of human suffering and a damning indictment of failed climate leadership.”Make no mistake, we all are witnessing a war; a war waged on our planet by the fossil fuel industry and those who benefit financially from these industries. Like most wars, money is needed to fund this endeavor. Federal taxpayer-funded grants, subsidies, and tax incentives help fuel the climate crisis by providing financial incentives for continued extraction. “Conservative estimates put U.S. direct subsidies to the fossil fuel industry at roughly $20 billion per year, with 20 percent currently allocated to coal and 80 percent to natural gas and crude oil.”Just like a conventional war, propaganda and lies are used to mold public opinion.“The fossil fuel industry has perpetrated a multi-decade, multibillion dollar disinformation propaganda and lobbying campaign to delay climate action by confusing the public and policymakers about the climate crisis and its solutions.”It is difficult to win a war when the cards are stacked against you, but the war for a livable planet is one we cannot afford to lose. It is time to demand renewable energy and stop subsidizing the companies responsible for the destruction of our planet. As Dr. Svitlana Krakovska of Ukraine said, “We will not surrender in Ukraine, and we hope the world will not surrender in building a climate-resilient future.” --Randi Jeannine Pokladnik
New York shows the challenges of phasing out fossil fuels, even in blue states - In December, when the New York City Council voted to ban natural gas use in new buildings, environmentalists in the Big Apple barely stopped to celebrate. Instead, they set their sights on a bigger target: making New York the first state in the country to phase out gas use in new buildings, a significant source of air pollution and planet-warming emissions. But the environmentalists suffered a setback last week, when the New York State Legislature omitted a building electrification measure from the state budget, delivering a victory to industry groups that argued the bill would raise utility bills. While climate activists pledged to keep pushing for the measure, the ongoing battle underscores the challenges that advocates face in seeking to curb fossil fuel use, even in blue states like New York that have set aggressive climate goals. The stakes are high. In 2019, lawmakers approved a landmark bill committing the state to cut its greenhouse gas emissions 40 percent by 2030 and at least 85 percent by 2050. Energy used for heating, cooling and lighting in buildings accounts for about 60 percent of emissions in New York. Dan Zarrilli, the former chief climate policy adviser to former New York City Mayor Bill de Blasio (D), said that New York risks missing its climate targets if new buildings are allowed to use gas appliances such as furnaces and stoves, rather than electric appliances such as heat pumps and induction cooktops. “We can’t keep installing new fossil fuel infrastructure if we hope to meet our goals,” Zarrilli told The Climate 202. “You know, when you’re in a hole, you’ve got to stop digging.” Karen Harbert, president and chief executive of the American Gas Association, a trade group, disagreed. “It would be a mistake to prevent homes and businesses in New York from signing up for natural gas service,” Harbert said in a statement. “I doubt New Yorkers will be happy about their policymakers raising their bills on a whim that will not achieve their environmental goals and forecloses on future emissions reduction opportunities.” New York Gov. Kathy Hochul (D) included a ban on gas use in new construction by 2027 in her executive budget for the next fiscal year. But the measure was absent from the final budget deal announced last week. Alex Beauchamp, Northeast region director for Food & Water Watch, said he thinks that Hochul bears some responsibility for the outcome in addition to State Assembly Speaker Carl Heastie. “Governor Hochul probably shares a part of the blame,” Beauchamp said. “This is clearly a governor who, if she had pushed, could have gotten this done and for whatever reason didn't feel the need to push on it.”
FERC approves MVP waterbody crossings - The Federal Energy Regulatory Commission has approved changes to the way waterbodies will be crossed in certain routes of the Mountain Valley Pipeline.FERC issued an order late Friday that approved, with conditions, MVP's request to use underground trenchless boring methods to cross 183 waterbodies and wetlands at 120 locations instead of an open-cut dry crossings approach to pipeline construction.However, MVP is asking the U.S. Army Corps of Engineers for approval to use open-cut methods to cross five waterbodies, according to the FERC filing. The Army Corps will decide on those requests separately.The FERC order also avoids a wetland and waterbody and allows MVP, when construction resumes, to work 24 hours a day at eight crossings using the trenchless method.The approval was needed because MVP, a 303-mile pipeline through West Virginia and Virginia to carry Marcellus and Utica shale natural gas, was no longer able to use a previous Army Corps of Engineers Nationwide Permit 12 approval that called for open-cut waterbody crossings. That Nationwide Permit 12 had been spiked by the U.S. Circuit Court of Appeals in November 2020, which required MVP to change the method.MVP is being built and will be operated and partially owned by Canonsburg-based Equitrans Midstream Corp. (NYSE: ETRN)."This is another important step forward in MVP's project completion and, as a critical infrastructure project, is essential for our nation's energy security, reliability, and ability to transition to a lower-carbon future," said MVP spokeswoman Natalie Cox.The approval doesn't immediately mean MVP can resume construction. It has, in the past three months, lost two key approvals — also from U.S. Circuit Court of Appeals decisions — and it will need to regain them and a U.S. Army Corp of Engineers go-ahead before construction can begin.A condition on FERC's approval "prohibits Mountain Valley from commencing construction activities associated with the Amendment Project until it receives authorization from the Corps to complete its proposed open-cut crossings."It's not clear how the approval will move the project forward immediately. While the pipeline had been, as late as early January, been expected to be completed by the end of the summer, Equitrans this year announced that it wouldn't happen due to the circuit court rulings. And it has yet to announce a new timeline. "This approval does not allow for new construction on the delayed pipeline, and key outstanding permits from the Forest Service, the FWS (Fish and Wildlife Service), and the Army Corps of Engineers must still be replenished," said Rob Rains, an analyst with Washington Analysis. "After this FERC approval, we maintain that the pipeline will most likely get competed, but we still also believe that there is no quick path forward, and that the project must thread the needle of receiving all its permits and dealing with litigation at the Fourth Circuit Court of Appeals."
After losing several permits, Mountain Valley Pipeline wins one for stream boring - After running into a series of roadblocks this year, Mountain Valley Pipeline has won approval to bore under about 180 streams and wetlands it must cross to complete the natural gas pipeline. In a unanimous order Friday afternoon, the Federal Energy Regulatory Commission authorized what is essentially one piece of the construction that remains unfinished due to adverse court rulings. FERC amended its 2017 certificate – perhaps the most important approval among more than a dozen federal and state permits – to allow Mountain Valley to tunnel below some water bodies, rather than digging a trench along their bottoms to bury a 42-inch diameter pipe using what’s called an open-cut process. Mountain Valley still lacks authorizations from other agencies to ford the remaining streams and wetlands by open cut, and to pass through the Jefferson National Forest. Also unresolved is the project’s impact on endangered species. The pipeline, which cuts through Southwest Virginia, nonetheless applauded FERC’s order. In its 72-page order Friday, FERC found that boring under water bodies would cause less environmental damage than the open-cut method. The commission had initially approved the method in 2017 for nearly 1,000 crossings, but those plans ran into legal challenges from environmental groups. “Today’s order amending Mountain Valley’s certificate will almost certainly represent an improvement over the status quo,” FERC Chairman Richard Glick and member Allison Clements wrote in a concurring opinion. Glick and Clements have previously voiced concerns about FERC “putting the cart before the horse” by approving work on the pipeline before the developer had obtained all of its required permits from other agencies. “Those concerns may be heightened when, as here, the permits and authorizations needed to develop the project have been vacated – several times – by the courts,” the opinion stated. But this case is different, Glick and Clements concluded, for three reasons. First, the amendment will actually reduce environmental damage. Second, no additional land would have to be taken by eminent domain for the “almost entirely constructed” pipeline. And thirdly, they wrote, the 4th U.S. Circuit Court of Appeals struck down a permit for the pipeline to pass through the national forest, in part, because the U.S. Forest Service and the Bureau of Land Management did not first consider FERC’s environmental analysis of boring under streams.
FERC approval boosts outlook for Mountain Valley pipeline, but hurdles remain The Federal Energy Regulatory Commission has approved Mountain Valley Pipeline's request to change water crossing methods in a decision that cleared one obstacle for the long-delayed natural gas pipeline project. Not rThe commission's order April 8 amended the original Mountain Valley permit issued in October 2017 to allow the project developer to bore under wetlands and water bodies along more than 70 miles of the pipeline route instead of using the previously approved open-cut method (CP16-10, CP21-57). "Mountain Valley's usage of trenchless waterbody crossings will result in fewer environmental impacts than the crossing method that the commission approved under the original certificate, meaning that today's order amending Mountain Valley's certificate will almost certainly represent an improvement over the status quo," FERC Commissioner Richard Glick and fellow Democratic Commissioner Allison Clements wrote in a concurring statement. The 2-Bcf/d, 304-mile gas pipeline project is almost complete, but litigation and permitting challenges delayed work on the final pieces. The FERC authorization was conditional pending new approvals from the US Fish and Wildlife Service under the Endangered Species Act, forest crossing authorizations from the US Forest Service and US Bureau of Land Management, and a water crossing permit by the US Army Corps of Engineers. Mountain Valley Pipeline proposed the alternative water crossing method in February 2021 after a court setback over stream crossing authorizations for the project. Clements and Glick said the April 8 approval did not authorize any route changes and would not affect any new landowners, "which helps to mitigate our longstanding concerns over the prospect of private property being condemned long before construction begins on a project that may never be fully approved." FERC unanimously approved Mountain Valley's alternative water crossing method at a time when the commission's Democratic majority has faced criticism over the FERC approach to permitting natural gas infrastructure. The criticism from lawmakers and industry has intensified as Russia's invasion of Ukraine caused a surge in European demand for US gas. The Mountain Valley developer described the FERC approval as a welcome development for the project that would connect Appalachian gas to downstream markets. "This is another important step forward in MVP's project completion and, as a critical infrastructure project, is essential for our nation's energy security, reliability, and ability to transition to a lower-carbon future," spokesperson Natalie Cox said in an April 11 email. Analysts at ClearView Energy Partners said the authorization was "very constructive to the project's outlook," though "hurdles remain." "FERC's order does not put MVP back into the field with new construction authorizations, but we do think it represents substantial evidence of federal regulatory support for the project,"
The United States ended the winter with the least natural gas in storage in three years - Increased heating demand for natural gas this past winter resulted in more withdrawals from U.S. natural gas storage than normal. By the end of March, the least amount of natural gas was held in U.S underground storage in the Lower 48 states since 2019.In January, temperatures across the country were colder than normal, which increased residential, commercial, and electric power demand for natural gas. More heating demand and record-high liquefied natural gas (LNG) exports resulted in above-average withdrawals from working natural gas storage despite increased natural gas production.Working natural gas in underground storage facilities in the Lower 48 states totaled 1,387 billion cubic feet (Bcf) as of March 31, 2022. Inventories were 17% lower than the previous five-year average (2017–21) for that time of year, according to our Weekly Natural Gas Storage Report. Temperatures were relatively mild across the United States from October through mid-January. Net withdrawals from underground storage facilities in the Lower 48 states during January totaled 991 Bcf—the most natural gas withdrawn from storage during any January since 2012. In January 2022, population-weighted heating degree days (a measure of how cold weather is) were 9% higher than the previous 10-year average, which led to higher-than-normal withdrawals in January.
Natural Gas Rallies as Much More Supply Needed to Avoid Winter Crunch; Cash Up -- It was off to the races for natural gas futures prices Monday as a bump in production did little to assuage growing concerns about supply later this year, especially in light of the latest weather data. With chilly weather seen boosting demand for most of this month, the May Nymex futures contract exploded 36.5 cents higher to $6.643/MMBtu. June futures settled at $6.723, up 36.7cents. Spot gas prices also strengthened, with hefty increases on the West Coast. NGI’s Spot Gas National Avg. jumped 21.0 cents to $6.205. Amid increasing worries that gas producers had yet to respond to higher prices, output finally took a notable step higher on Monday. Bloomberg estimates showed production reaching 96.4 Bcf. At the same time, liquefied natural gas (LNG) feed gas demand was little changed at around 12.6 Bcf, according to NGI data. LNG was tracking well below highs in the 14 Bcf range earlier this month and throughout much of March. Bespoke Weather Services questioned whether these bearish factors would be enough to turn the tide in sentiment and allow prices to stage a meaningful pullback. “That is a tough guess.” After such a strong price move higher since the middle of March, a break in the rally, even if temporary, would not be a big surprise, according to Bespoke. Alternatively, the market may want to see proof in upcoming government inventory data that balances have loosened enough to at least “tone down” the level of concern regarding storage levels. In order to start making some improvement in storage levels, however, the weather needs to cooperate. Instead, Bespoke said the coming 12 days are seen as a bit cooler in the eastern half of the country. This would push the projected total April gas-weighted degree day count up above 420, well above April 2021 but under 2020 levels. Although more widespread warmth continues to get kicked down the road, EBW Analytics Group pointed out Canadian imports have remained strong. Exports to Mexico also have edged lower seasonally, providing at least some short-term relief in balances. The firm said once milder spring air takes hold across the country, storage deficits may begin to recede by late April. This could help turn back recently irrepressible bullish momentum. Longer term, however, the end-of-October storage outlook has fallen to 3,450 Bcf, down 150 Bcf the past month.
-U.S. natgas futures hit 13-year high on coming cold (Reuters) - U.S. natural gas futures edged up to a 13-year high on Tuesday with a sharp drop in U.S. output and expectations freezing weather in Alberta, Canada, will boost heating demand as it moves into the United States next week. Chicago, which gets some gas from Alberta, has already seen next-day gas prices rise to their highest since the February freeze in 2021. That price spike came even though the Windy City weather was still about five degrees warmer than normal at 63 degrees Fahrenheit (17.2 Celsius). After rising almost 5% earlier in the session along with a 7% jump in crude futures, traders said U.S. gas prices pulled back after midday forecasts called for less cold weather over the next two weeks than previously expected. U.S. front-month gas futures rose 3.7 cents, or 0.6%, to settle at $6.680 per million British thermal units (mmBtu), their highest close since November 2008 for a second day in a row. U.S. gas futures have already soared about 78% so far this year with much higher prices in Europe keeping demand for U.S. liquefied natural gas (LNG) near record highs as several countries try to wean themselves off Russian gas after Russia invaded Ukraine on Feb. 24. Analysts said that in addition to high global LNG demand, U.S. prices were rising on domestic concerns, including growing worries that cooler weather in April will keep heating demand high enough to prevent utilities from injecting much gas into storage. U.S. gas stockpiles were currently around 17% below the five-year (2017-2021) average for this time of year. In the spot market, gas prices for Tuesday at the AECO hub in Alberta rose to their highest since March 2014 as homes and businesses crank up their heaters to escape a spring freeze. AccuWeather forecast high temperatures in Calgary, the biggest city in the province, would remain below freezing for much of this week. That compares with a normal high of around 51 F in the city at this time of year. Traders noted that Alberta's cold, expected to reach the United States next week, would reduce gas exports from Canada. Data provider Refinitiv said average gas output in the U.S. Lower 48 states rose to 94.6 billion cubic feet per day (bcfd) so far in April from 93.7 bcfd in March. That compares with a monthly record of 96.3 bcfd in December. On a daily basis, however, preliminary data showed output was on track to drop 1.9 bcfd to 93.4 bcfd on Tuesday due mostly to declines in Appalachia. That would be the biggest daily decline since freezing weather shut wells in early February. The amount of gas flowing to U.S. LNG export plants slid from a record 12.9 bcfd in March to 12.3 bcfd so far in April due mostly to declines at Freeport LNG's facility in Texas and Cheniere Energy Inc's Sabine Pass in Louisiana. The United States can turn about 13.2 bcfd of gas into LNG. The amount of feedgas flowing to Sabine Pass on Tuesday was on track to fall to a preliminary 3.2 bcfd, the lowest since October 2021.
U.S. natgas futures soar 5% to 13-year high on rising spot prices (Reuters) - U.S. natural gas futures jumped about 5% to a fresh 13-year high on Wednesday on a drop in daily output, a rise in daily feedgas to liquefied natural gas (LNG) export plants and forecasts for unusual cold in Alberta, Canada and unusual heat in the U.S. Mid Atlantic region. Next-day prices in Pennsylvania jumped to their highest since the February freeze in 2021 as some consumers dusted off their air conditioners for the first time this year to escape a brief hot spell. Traders noted U.S. futures rose even though the latest forecasts called for less cold and lower-than-expected heating demand in the United States over the next two weeks. U.S. front-month gas futures rose 31.7 cents, or 4.7%, to settle at $6.997 per million British thermal units (mmBtu), their highest close since November 2008, for a third day in a row. U.S. gas futures have already soared about 89% so far this year with much higher prices in Europe keeping demand for U.S. LNG near record highs as several countries try to wean themselves off Russian gas after Russia invaded Ukraine on Feb. 24. One of the more surprising observations about the recent U.S. price run-up was that while U.S. gas prices have soared about 51% over the past month, European gas, currently trading around $33 per mmBtu, fell about 7% because Russia keeps sending supplies via pipeline and LNG vessels keep delivering cargoes. Analysts said that in addition to high global LNG demand, U.S. prices were rising on domestic concerns including growing worries that cool weather in April could keep heating demand high enough to prevent utilities from injecting much gas into storage. U.S. gas stockpiles were currently around 17% below the five-year (2017-2021) average for this time of year. Data provider Refinitiv said average gas output in the U.S. Lower 48 states rose to 94.6 billion cubic feet per day (bcfd) so far in April from 93.7 bcfd in March. That compares with a monthly record of 96.3 bcfd in December. The amount of gas flowing to U.S. LNG export plants slid from a record 12.9 bcfd in March to 12.4 bcfd so far in April due mostly to declines at Freeport LNG's facility in Texas. The United States can turn about 13.2 bcfd of gas into LNG. On a daily basis preliminary data showed feedgas was on track to rise from 11.5 bcfd on Tuesday to 12.5 bcfd on Wednesday.
US natural gas storage rises 15 Bcf, lifting stocks to 1.397 Tcf as deficit grows | S&P Global Commodity Insights -- US natural gas storage activity flipped back to net injections in the first week of April with an undersized addition to stocks widening the deficit and provoking a bullish reaction in the Henry Hub gas futures market. The US Energy Information Administration April 14 announced a 15 Bcf injection to US storage for the week ending April 8—its second reported build of the season, following a one-week hiatus for injections. The build was 5 Bcf more than what was anticipated by an S&P Global Commodity Insights survey of analysts that called for a 10 Bcf addition to stocks in the first week of April. The modest injection lifted US working gas inventories to 1.397 Tcf in the week ended April 8. The storage deficit widened during the week with stocks falling to 439 Bcf, or about 24%, below the year-ago level of 1.836 Tcf and 303 Bcf, or 18%, below the five-year average of 1.7 Tcf, EIA data showed. Immediately following the EIA storage report's release, NYMEX Henry Hub prompt-month futures gained about 15-20 cents, trading at historic levels as high as $7.25/MMBtu, data from the CME group showed. The resumption of net injections to gas storage has done little to cool bullish sentiment in the futures and forwards markets as lingering, cool spring weather exacerbates this season's abiding inventory deficit—promising to fuel additional storage demand during the upcoming summer months. OutlookFor the week ending April 23, temperatures are forecast to remain well below average across the Upper Midwest, throughout the Mississippi River Valley, and along the Eastern Seaboard, according to a six- to 10-day outlook the US National Weather Service published April 13. A regional weather forecast published by S&P Global shows average temperatures across the Midcontinent market area remaining nearly 9 degrees Fahrenheit below normal over the next seven days. In the Northeast—another key heating market—temperatures are expected to average about 2 F below normal. In both regions, heating demand is expected to outpace seasonal averages. For the reporting weeks ending April 15 and April 22, S&P Global's gas supply-demand model is currently predicting injections of 45 Bcf and 42 Bcf, respectively. Assuming that forecast is correct, US inventories would widen their gap to the five-year average to 311 Bcf—potentially making for the largest storage deficit yet this season. Depleted inventories will ultimately require compensatory injection demand to reach pre-winter levels anywhere close to normal this year, which on average amounts to more than 3.6 Tcf by early November, EIA data shows. This summer, though, utilities and storage traders looking to replenish US stocks will be forced to compete with potentially record export demand.
Natural Gas Prices Soar to Fresh Highs After EIA Storage Data Confirms Tight Balances - Natural gas futures finished off the short holiday week with another huge leap higher after the latest inventory data confirmed a sluggish start to the injection season. The May Nymex gas futures contract settled Thursday at $7.300, up 30.3 cents on the day. June futures raced 32.7 cents higher to $7.423. Momentum continued in the spot gas market as well ahead of a chilly weather pattern seen continuing until the last week of April. NGI’s Spot Gas National Avg. climbed 28.0 cents to $6.805. Trading action on Thursday began much like it has on most days this week, with futures prices up at the open as Russia’s war in Ukraine continues to provide a volatile backdrop for an increasingly bullish long-term outlook for U.S. gas. Though global gas prices softened ahead of the long Easter weekend, a quick reversal could quickly occur in the event Russia halts gas shipments to Europe. Russian President Putin has demanded payment for his country’s gas supplies in rubles, threatening to halt shipments to buyers that fail to comply. [Want today’s Henry Hub, Houston Ship Channel and Chicago Citygate prices? Check out NGI’s daily natural gas price snapshot now.] A look at March flows, however, indicates that Russian liquefied natural gas (LNG) exports increased by 19% year/year to 3.1 million tons last month, according to shipbroker Banchero Costa. Shipments from the country were also 25% higher than they were in March 2020. Nevertheless, the potential for a stop in Russian gas flows to Europe has kept the market on edge. Against that backdrop, concerns are growing that the Lower 48 could have supply issues of its own next winter. The lingering heating demand, combined with a failure of production to break out of its months-long range, have set up a tall order for the gas market to ensure adequate supply at the end of October. The latest government inventory data confirmed that trend. The Energy Information Administration (EIA) on Thursday reported a 15 Bcf injection for the week ending April 8, in line with expectations but far under historical norms. During the same week last year, the EIA said stocks rose by 55 Bcf, while the five-year average build is 33 Bcf. The South Central recorded the largest increase in stocks, which were up by a net 28 Bcf, according to EIA. This included a 15 Bcf build in nonsalt facilities and a 13 Bcf build in salts. Pacific inventories added a modest 4 Bcf. However, the continued bursts of cold resulted in yet another drawdown in East and Midwest inventories, which fell by 12 Bcf and 3 Bcf, respectively. Total working gas in storage as of April 8 was 1,397 Bcf, which is 439 Bcf below stocks at this time last year and 303 Bcf below the five-year average, EIA said.
U.S. Natural Gas Prices To Spike As Exports Boom --Europe is determined to wean itself off Russian natural gas following Putin’s decision to invade Ukraine, and U.S. LNG is one of the major alternatives. Europe recently had to reconsider its emissions-cutting ambitions in light of the danger of an unprecedented energy crunch. U.S. natural gas producers are only too happy to help. Cue worries about a domestic shortage.European Union governments have been discussing for weeks ways to cut their reliance on Russian oil and gas.There have beenclaims that the EU can make it through the summer even if gas imports from Russia are cut because there is enough gas in storage. Still, Brussels has stopped short of imposing an embargo on Russian gas, with Germany admitting it cannot afford one.There have been plans to reduce the overwhelming dependence on Russian gas by urgently finding alternative suppliers, including pipeline gas from North Africa and Central Asia, and liquefied natural gas from Qatar and the United States. And the United States has been eager to help.President Bidenpledged an additional 15 billion cubic meters of natural gas exports to the European Union this year in the form of LNG, while the EU pledged to create the demand for 50 billion cubic meters annually of U.S. LNG “until at least 2030”.Before the mutual pledges, Europe had already become the largest buyer of U.S. LNG at the start of this year, taking in a record 12.5 billion cubic meters in the form of the super-chilled fuel. But there is a problem. Demand, especially from Europe, is set to rise sharply this year: Wood Mac expects European LNG to add 25 metric tons by the end of 2022. Global supply, on the other hand, is seen adding 17 million tons.The signs of this imbalance are already visible in the United States. Last week, natural gas priceshit the highest level in 13 years, and while some analysts blamed it on the coal price rally, record LNG exports certainly contributed to the trend.Natural gas prices are “sensitive to any near-term supply concerns created by events like a ban on Russia coal exports, abnormally cold weather,” Tortoise portfolio manager Rob Thummel told MarketWatch last week. But perhaps more importantly, U.S. natural gas stocks have fallen.For the week ending April 1, the Energy Information Administration reported that national natural gas stocks were 17 percent below the five-year seasonal average. The agency noted that stocks of working gas were within the five-year average, and yet prices continued to rise.Reuters’ John Kemp noted in a recent column that U.S. natural gas stocks ended the winter of 2021-2022 at a three-year low of 1.382 trillion cubic feet. Working stocks, he also reported, were 19 percent below the pre-pandemic five-year average for the start of April. And all that was because of higher exports.
The Enduring Myth of America’s “Molecules of Freedom” More than six weeks after Russia’s invasion of Ukraine and an unprecedented scramble to reduce the West’s reliance on Russian oil, a narrative about America’s newfound position as a leading fossil fuel producer (and provider) has taken firmer hold of the country’s imagination. To some, it’s almost as though fracking has saved American democracy.This pairing of ideas is hardly new. For decades, the United States has been chasing the dragon of “energy independence” as core to its international interests. It was true the last time the country was dealing with high gas prices, in the wake of the 1973 oil crisis. Back then, the U.S. was the one being sanctioned—by the Arab members of OPEC for American support of Israel during the Arab–Israeli war. The shock of high gas prices and rationing prompted the U.S. government in 1975 to put a ban on U.S. companies exporting oil and gas. That ban remained in place until 2015 when President Obama, after an intense amount of lobbying pressure from the petroleum industry during the heady days of the fracking boom, lifted it.By then, interests had flipped, and now exporting fracked oil and gas was positioned as helping the domestic goal of energy independence. All of a sudden, there were plenty of fossil fuels to go around. If we could be global suppliers of the world’s oil and gas, the story went, we would have more power over world events. “They told people here [in Appalachia], whose sons were off fighting in Iraq, that it was their patriotic duty to lease their land for fracking. That this was how we would get out of Iraq and avoid the next war in the Middle East,” says Heaven Sensky, a fracking lease-holder in Southwestern Pennsylvania who now works with the nonprofit Coalfield Justice to hold fracking companies accountable for their impact on communities. The truth, however, is that the “drill, baby, drill” playbook that has driven domestic policy for more than a decade has failed to deliver the promised energy security. Americans are just as dependent on and impacted by the global energy market as any other country, and now the country’s position as an oil and gas exporter is helping push America toward an escalating energy confrontation with its Cold War foe—with the help of frackers eager to “rescue” Europe by snatching away Russia’s customers.As the old saying goes, if we’re fooled twice, shame on us.It’s hard to overstate the hype that surrounded fracking, and the bipartisan support it enjoyed, in America throughout the 2010s. In Obama’s 2012 State of the Union address, he declared that fracking could unlock enough natural gas from under America’s soil to supply cheap domestic energy for a hundred years. Fracking also offered the promise of escaping the seeming inevitability of Rust Belt decline. Obama predicted that it would create 600,000 jobs by the end of the decade, and in 2016, then-presidential candidate Ted Cruz proclaimed that the industry would create “millions of millions of new high-paying [manufacturing] jobs.” What’s more, because methane combustion emits about half as many pounds of carbon dioxide per million BTU of energy as does coal, shale gas was also widely touted as a “bridge fuel” to renewable energy.
Higher Natural Gas Prices Boost Haynesville Production to Record Highs in 2021, Says EIA - After years of declines, dry natural gas production from the Haynesville Shale reached record highs in the second half of 2021 as prices rose, according to the U.S. Energy Information Administration (EIA). The government agency said Haynesville gas production climbed to around 12 Bcf/d by the end of 2021, up from around 10 Bcf/d at the start of the year. Output from the East Texas/Northwest Louisiana play remains strong so far this year as well, with producers adding 17 rigs in the Haynesville since January, according to Baker Hughes Co. (BKR). For the week ending April 8, BKR data showed that there were 64 natural gas-directed rigs operating in the Haynesville, representing 45% of natural gas-directed rigs currently operating in the United States. “Producers tend to increase or decrease the number of drilling rigs in operation as natural gas prices fluctuate,” said EIA researcher Katy Fleury. To that end, Henry Hub natural gas prices have risen sharply over the past year, from around $2.500/MMBtu in January 2021 to $6.56 on April 12, according to NGI’s Daily Gas Price Index. Fleury noted that the number of natural gas-directed rigs in the Haynesville has steadily increased since the second half of 2020, reaching an average of 46 rigs in 2021. This growth follows a sustained decline in production from mid-2012 through 2016 because of the Haynesville’s relatively higher cost to produce. “At depths of 10,500 ft. to 13,500 ft., wells in the Haynesville are deeper than in other plays, and drilling costs tend to be higher,” Fleury said. “By comparison, wells in the Marcellus Shale in the Appalachian Basin are shallower, between 4,000 ft. and 8,500 ft.” Years of relatively low natural gas prices meant it was less economical to drill deeper wells, according to Fleury. However, because natural gas prices have increased since mid-2020, producers have an incentive to increase the number of rigs in operation and use those rigs to drill deeper wells. To be sure, the Haynesville accounted for 13% of all U.S. dry gas production in February, EIA said. Pipeline takeaway capacity out of the Haynesville has also increased in recent years, allowing producers to reach industrial demand centers and liquefied natural gas terminals on the Gulf Coast, according to EIA. EIA’s latest Drilling Productivity Report shows Haynesville output climbing 173 MMcf/d month/month in April. Operators are drawing down their backlog of drilled but uncompleted wells in order to boost production, though the number of drilled but uncompleted wells in the Haynesville was flat from January to February at 369. The Haynesville is the third-largest shale gas-producing play in the United States, according to the agency. The Marcellus – mainly in Pennsylvania, West Virginia and Ohio – takes the top spot, averaging 31.7 Bcf/d in 2021. The Permian Basin of West Texas/Southeast New Mexico is the second largest producing basin, averaging 12.4 Bcf/d last year. Altogether, the Marcellus, the Permian and the Haynesville account for 52% of U.S. dry natural gas production, EIA said.
Natural gas-fired generation peaked in 2020 amid growing renewable energy production: IEEFA Natural gas-fired power production likely peaked in 2020 and will gradually be driven lower by higher gas prices and competition from growing amounts of wind and solar capacity, according to the Institute for Energy Economics and Finance, a nonprofit group that supports moving away from fossil fuels. Any increased U.S. liquefied natural gas exports to help Europe shift away from Russian purchases would put upward pressure on domestic gas prices, making renewable energy in the U.S. even more competitive compared with gas-fired generation, Seth Feaster, IEEFA energy data analyst, said Tuesday during a webinar on the organization's U.S. 2022 Power Sector Outlook. However, IEEFA doesn't expect the conflict in Ukraine will in any "significant degree" affect the long-term transition toward renewable energy and battery storage in the U.S. power sector, according to Dennis Wamsted, an editor and energy analyst with IEEFA.IEEFA expects wind, solar and hydroelectric generation will make up a third of U.S. power production by 2027, up from about 19% in December, according to its report. "The transition has just started," Wamsted said. "We do believe that the takeoff is right now."The recent increase in gas prices and concerns about methane emissions from gas production and distribution are adding to the challenges facing gas-fired generation, which hit a record high in 2020 of 1.47 billion MWh, according to IEEFA."The soaring cost of fossil fuels and unexpected disruptions in energy security are now supercharging what was already a torrid pace of growth in solar, wind and battery storage projects," IEEFA said in the report.The utility sector is speeding up its exit from coal-fired generation, Wamsted said, pointing to recently announced plans by Georgia Power, the Tennessee Valley Authority and Duke Energy to retire their coal fleets by 2035.Since the U.S. coal fleet peaked in 2012 at 317 GW, about 100 GW has retired and another 100 GW is set to shutter by the end of this decade, partly driven by federal coal ash and water discharge regulations, according to Wamsted.About three-quarters of the generation expected to come online in the next three years is wind, solar and batteries, IEEFA estimated, based on Energy Information Administration data.At least 19,000 MW of offshore wind is under development along the East Coast, with about half of the capacity slated to be online by 2028, according to IEEFA. That capacity will displace fossil-fueled generation in the eastern power markets run by ISO New England, New York Independent System Operator and the PJM Interconnection, Wamsted said.Some of IEEFA's findings were echoed by the EIA's short-term energy outlook issued Tuesday.The agency expects the share of U.S. electricity generation from wind and solar farms will grow to 22% this year and to 23% in 2023, up from 20% last year. Driven by the expected increase in renewable generation, gas-fired generation falls to 35% of U.S. power production this year and in 2023, down from a 37% share in 2021.
Export-Import Bank plan may affect U.S. LNG, renewables -The board of the Export–Import Bank of the United States yesterday approved a new tool meant to support domestic export projects, opening financing options to facilities associated with liquefied natural gas, renewables and energy storage. The initiative will provide access to the agency’s “existing medium- and long-term loans and loan guarantees to American manufacturing projects that export,” according to a statement from the Ex-Im Bank, the nation’s official export credit agency.Advocacy groups for the U.S. LNG sector quickly welcomed the plan, saying it could help projects overcome funding challenges and support thousands of jobs. Environmentalists expressed concern that new LNG financing could take money away from renewable energy. The new tool will be available to all sectors, the Ex-Im Bank said, provided that projects meet environmental laws and other requirements. “The Make More in America Initiative will create new financing opportunities that spur manufacturing in the United States, support American jobs and boost America’s ability to compete with countries like China,” Reta Jo Lewis, the Ex-Im Bank’s president and chair, said in a statement yesterday. LNG has been in the spotlight in recent weeks as Russia’s invasion of Ukraine disrupts global energy markets. The United States moved to ban oil, LNG and coal imports from Russia. European countries also are seeking to reduce their dependence on Russian energy. Observers have said Russia’s actions present a business opportunity for the U.S. gas industry. More than a dozen LNG projects have been federally approved but not yet built. That suggests the U.S. industry could roughly double its exports without a major regulatory approval (Energywire, March 9).The new bank initiative incentivizes applications in “environmentally beneficial, small business and transformational export transactions,” according to the Ex-Im Bank’s statement, which listed energy storage and renewable energy, in addition to semiconductors, biotech and biomedical products.While the Ex-Im Bank’s release didn’t specifically mention LNG, industry advocate LNG Allies said U.S. LNG export projects are “clearly” environmentally beneficial, saying they “mostly displace coal use in foreign power projects” or dirtier Russian gas. “U.S. LNG exports are both environmentally beneficial and transformational, two adjectives the release specifically uses to call out projects they would be supporting,” said Charlie Riedl, executive director of the Center for Liquefied Natural Gas, in an email.
USA Refinery Run Rate Very High for April - In this week’s preview of what to watch in oil and gas markets, Rigzone’s regular energy prognosticators take a look at the U.S. refinery run rate, Strategic Petroleum Reserve release destinations, growth in the context of pandemic recovery and more. Read on below to find out the specifics. Rigzone: What developments/trends will you be on the lookout for this week?
- Tom Seng, Director – School of Energy Economics, Policy and Commerce, University of Tulsa’s Collins College of Business: The EU has proven too dependent on Russian oil and natural gas to initiate any boycotts at this time. The market will have to look to the additional, non-energy sanctions against Russia for any impact on resolving the Ukrainian crisis. U.S. refiners running at 92.5 percent is a very high level for April, a month normally reserved for maintenance and ‘turn-around’ ahead of the summer driving demand season. Will we see a significant reduction in capacity over the next 30-60 days? And, have the Western nations ‘pulled all the rabbits out of their hats’ in terms of increasing global oil supplies? It would seem so.
- Hillary Stevenson, Director, Industry Relations at oil and gas data firm Validere: Will be watching to see where U.S. SPR releases are headed. It is likely that some purchases will head to foreign destinations due to the cheaper waterborne transit, as the Jones Act would require U.S. flagged vessels to carry barrels to other U.S. ports. The DOE noted that any bid submitted in the SPR sale should not be ‘contingent’ on receiving a Jones Act waiver or vessel.
- John Stilwell, Principal-in-Charge, Energy – Power and Utilities, Grant Thornton LLP: Short- and long-term negative impacts to growth in the context of the pandemic recovery continues to be the theme. The widespread impact of the war in Ukraine will continue to be factor that the world will continue to monitor. The question is: Can the West remain united against Russia with the underlying stress to energy markets, supply chain and macroeconomic pressures?
U.S. crude output will rise at slower-than-expected pace, EIA says — U.S. crude output will grow at a more diminished pace than previously expected as shale producers grapple with higher production and labor costs amid rampant inflation. Production in 2022 is now expected to average 12.01 million barrels a day compared to the previous forecast of 12.03 million barrels a day, according to the Energy Information Administration. The revisions come as the Biden Administration struggles to contain surging inflation stoked by rising energy costs. Oil skyrocketed above $100 as the war in Ukraine has limited Russian crude exports into the global market while OPEC and its allies struggle to meet production targets. Meanwhile, many publicly traded oil producers in the U.S. have increased production at a more moderate pace compared with previous price booms as investors pressure them to boost returns. For 2023, the EIA expects production to rise by 940,000 barrels a day to average 12.95 million, compared to its previous forecast for a rise of 960,000 barrels a day. Oil demand is expected to rise 800,000 barrels a day to 20.58 million versus an increase of 870,000.
Shell's 13-year journey from discovery to first oil shows why U.S. output remains flat — Questioned by U.S. lawmakers this week, chief executives from the nation’s biggest oil companies took great pains to explain why they haven’t raised production fast enough to tame skyrocketing energy prices. For Shell Plc’s highest-ranking U.S. manager, Gretchen Watkins, the answer was 1,600 miles (2,600 kilometers) southwest of Capitol Hill, floating in a shipyard near Corpus Christi, Texas. As Democratic lawmakers grilled Watkins and other executives about high gasoline prices, hundreds of workers in red and tan coveralls were putting the finishing touches on the Vito offshore oil platform. The 20-story production facility that weighs as much as a battleship is expected to begin pumping the equivalent of up to 100,000 barrels daily from beneath the Gulf of Mexico later this year. By then, the multibillion-dollar project will have taken 13 years to evolve from the initial discovery of the Vito oilfield to production, underscoring the challenges of bringing offshore crude to market. Unlike shale wells that cost $10 million or $15 million to drill and mere months to yield oil, offshore projects cost billions and rarely come online in less than a decade. This difference in business models explains why it’s so difficult for oil giants such as Shell to quickly ramp up production when geopolitical disruptions like Russia’s war in Ukraine upend markets. With crude fetching more than $100 a barrel, and retail gasoline prices soaring, politicians and consumer advocates want to know why the oil industry isn’t pumping faster.
How Shell’s new Gulf platform will make money at almost any oil price - Shell’s new multibillion-dollar offshore oil platform is parked outside Corpus Christi for its finishing touches. The thwack of compressed air set a rhythm as workers readied the semi-submersible facility for launch offshore Louisiana in June. Slated to produce oil by year-end, the new platform aims to be among the world’s most efficient. It's part of a new wave of reinvented offshore platforms engineered to be smaller, less-energy intensive and more sustainable. Nicknamed Vito, the hub got its start in the years after the oil bust of 2014-16, as oil majors started devising ways to make pared down versions of platforms to reduce costs. Now that’s even more important as the energy transition accelerates and pressure mounts on producers to cut emissions.While Shell isn't revealing the project’s cost, the company said it has cut Vito’s cost by 70 percent from its initial design, helping it to remain profitable even if crude falls to near $35 a barrel. And though oil now hovers around $100, prices are unlikely to stay elevated, said Kurt Shallenberger, Shell’s project manager for Vito.“You don’t design for a single cycle,” he said, referring to the booms and busts of the market.Vito will operate in a 4,000-foot deep Gulf field some 150 miles southeast of New Orleans. Shell owns more than 63 percent of the project, set to produce 100,000 barrels of oil a day, while Norway-based Equinor owns the remaining 36.9 percent.
Baker's US Natural Gas Tally Rises as Drilling Activity Focused in Texas -The U.S. natural gas rig count rose two units to 143 for the week ended Thursday (April 14), matching a two-rig increase in oil-directed drilling for the period, the latest figures from Baker Hughes Co. (BKR) show. The combined U.S. rig count climbed to 693 for the week, up 254 units from its year-earlier total of 439. Land drilling increased by five rigs, partially offset by the departure of one rig from inland waters. The Gulf of Mexico count held steady at 12 rigs. [Want to know how global LNG demand impacts North American fundamentals? To find out, subscribe to LNG Insight.] Five directional rigs were added, with total vertical rigs declining by one, according to the BKR numbers, which are based in part on data from Enverus. In Canada, four oil-directed rigs and four natural gas-directed rigs exited during the week, dropping the Canadian count eight units to 103. That’s up from 56 in the year-earlier period. Broken down by major drilling region, the Eagle Ford Shale led with an increase of three rigs, raising its count to 60, versus 33 in the year-ago period. The Permian Basin added two rigs for the period, while the Barnett Shale and Cana Woodford each added one rig to their respective totals. Counting by state, Texas gained four rigs week/week, raising its total to 346. West Virginia added two rigs, offsetting a two-rig decline in Pennsylvania. Oklahoma and Alaska added one rig each, while Louisiana and New Mexico each dropped one rig week/week, the BKR data show.Oil flowing from Permian on heels of COVID-19, Russia-Ukraine conflict - A crude oil pipeline shipping oil from the Permian Basin to export markets along the Gulf Coast reported last week it was moving about half a million barrels a day across Texas to the Corpus Christi area throughout 2022 so far. EPIC Crude Holdings first built the pipeline in 2017 to stretch 700 miles from the Permian Basin in southeast New Mexico and West Texas to the coast in southeast Texas. The 30-inch line extends from Orla, Texas in the Permian to the Port of Corpus Christi, serving operators in the Permian’s Delaware and Midland sub-basins and the Eagle Ford Basin in southern Texas. More: Fluctuating oil prices do not hamper February oil and gas tax collections for Eddy County The pipeline has a capacity of 600,000 barrels per day, and storage of 7.5 million barrels throughout its network of terminals throughout Texas in Orla, Pecos, Crane, Wink, Midland, Hobson and Gardendale. EPIC Chief Executive Officer Brian Freed said the system was intended and continue to take advantage of heavy ongoing growth in Permian Basin oil production. "Our crude volume throughput proves EPIC’s strategic importance for customers to provide safe and reliable crude oil transport out of the Delaware, Midland and Eagle Ford basins into the Corpus Christi market,” Freed said. Along with shipping large quantities of fossil fuels to market in recent months, the Permian was also the site of billions of dollars in land and asset sales this year, as energy companies sought to capitalize on growing fuel demands via expansive oil and gas deposits in the region. The latest was a $624 million sale of a Permian-focused subsidiary of Denver-based midstream company 3Bear Energy to Delek Logistics of Tennessee. Included in the sale were all of 3Bear’s assets in the region which include about 350,000 acres, 485 miles of pipelines, 88 million cubic feet per day of natural gas processing capacity, 120,000 barrels of crude oil storage capacity and 200,000 barrels per day of water disposal.
Record Permian Well Drilling Permits Point to Growing U.S. Oil Supply -— Drilling permits for new wells have spiked to unprecedented levels in the Permian Basin, signaling crude oil suppliers in America are finally responding to higher prices, according to Rystad Energy. A total of 904 horizontal drilling permits were awarded last month in the shale patch that lies beneath Texas and New Mexico, an all-time-high, Rystad said. The four-week average of 210 approved permits for the week ending April 3 was also a record. “This is a clear signal that operators in the basin are kicking into high gear on their development plans, positioning for a significant ramp-up of activity level,” Artem Abramov, Rystad Energy’s head of shale research, said in a note to clients. The move “foreshadows a significant increase in supply capacity from early 2023,” he added. The world is counting on the U.S. to increase crude production after Russia’s invasion of Ukraine disrupted supplies and sent oil prices rallying. Texas wildcatters have been saying that higher costs on labor and equipment and investors’ pressure to keep spending under control limits their ability to expand production.
As Oil Giants Turn to Bitcoin Mining, Some Spin Burning Fossil Fuels for Cryptocurrency as a Climate Solution -Flaring — or the burning of stranded natural gas directly at an oil well — is one of the drilling industry’s most notorious problems, often condemned as a pointlessly polluting waste of billions of dollars and trillions of cubic feet of natural gas.In early March, oil giant ExxonMobil signed up to meet the World Bank’s “zero routine flaring by 2030” goal (a plan that — when you look just a bit closer — doesn’t entirely eliminate flaring but instead reduces “absolute flaring and methane emissions” by 60 to 70 percent.)How does ExxonMobil plan to reach that goal? In part, it turns out, by burning stranded natural gas directly at its oil wells — not in towering flares, but down in mobile cryptocurrency mines.Using the energy-intensive process of crypto mining to fight pollution is the latest in a wave of claimed climate “solutions” whose environmental benefits seem to only appear if you squint at them from very specific angles — like “low carbon” oil, measured not by the oil’s actual carbon content but by how much more carbon was spent to obtain it.Critics point out that replacing flaring with mining crypto could become a way for fossil fuel producers to spin money directly from energy, polluting the climate without heating people’s homes or transporting people from place to place in the process. “In terms of productive value, I would say there is none,” Jacob Silverman, a staff writer at the New Republic, said in a recent interview. “The main value of cryptocurrency is as a tool for speculation. People are trying to get rich.”That, of course, includes oil drillers. “This is the best gift the oil and gas industry could’ve gotten,” Adam Ortolf, a crypto mining executive, told CNBC. “They were leaving a lot of hydrocarbons on the table, but now, they’re no longer limited by geography to sell energy.” Using crypto mining to sponge up unused natural gas could carry environmental benefits, for example, if you compare that option against flaring that gas and using other supplies of natural gas to mine that same crypto. But, in reality, there are a lot of other moving pieces at play, including calls for cryptocurrency to start lowering its energy demand.Bitcoin, in fact, has grown so energy intensive that tech industry insiders have begun openly discussing the ways that it’s causing a “climate crisis.”“A single ledger in bitcoin consumes enough energy to power your house for almost a day,” Intel CEO Pat Gelsinger told Bloomberg in mid-February. “That’s a climate crisis.”“If we produce a technology that consumes that much energy,” he added, “wow, that’s not okay.”Meanwhile, oil giants like Exxon have begun increasingly eying cryptocurrency mining — which could directly connect the world’s biggest producers of fossil fuels to an industry with an ever-expanding appetite for energy. A pilot project in North Dakota’s Bakken shale has already allowed ExxonMobil to steer up to 18 million cubic feet of gas a month into bitcoin mining ventures in 2021, Bloombergreported last week, adding that the oil giant is considering expanding cryptocurrency mining pilots into Alaska, Germany, the Qua Iboe Terminal in Nigeria, the Vaca Muerta shale in Argentina, and Guyana — a small South American country that ExxonMobil pushed into the ranks of the top ten gas-flaring countries in 2020. AnExxon is hardly alone. ConocoPhillips has also launched a Bakken shale pilot program. The two are founding members of the OOC Oil & Gas Blockchain Consortium, whose members also include Chevron, Equinor, Hess, Pioneer, and others. Russia also recently announced that it would accept bitcoin as payment for fossil fuels and crypto mining companies have described talks with officials from Saudi Arabia and other major oil producers.
Texas shale oil fields face worst fire risk in almost a decade — Some of the worst fire conditions in a decade are going to sweep across Texas and the southern Great Plains, threatening key shale-oil fields, slaughterhouses and farms. Dry gusting winds and low humidity will create extreme fire weather from Kansas to West Texas, including Midland and Odessa, the U.S. Storm Prediction Center said. “This is one of the higher- end fire weather patterns we have seen in the last decade or so,” said Nick Nauslar, a government fire weather forecaster. Tuesday “is going to be a big day.” “ The central Plains and the western U.S. have been suffering from drought for months, leaving wheat crops parched of no rain. Ranchers may not have enough feed for their livestock. Almost 85% of Texas is in drought and more than 75% of Oklahoma is parched, according to the U.S. Drought Monitor. With grasses dried out and ready to burn, the warm dry winds could catch any flames in the area and send them spreading wildly. “It is a pretty good recipe for big fires and critical fire weather conditions,” Nauslar said. A powerful early spring storm is raking the southern U.S. with dry gusting winds, while dropping heavy snow. Blizzards across Montana may bring as much as 23 inches (58 centimeters) of snow. Red flag fire warnings cover parts of seven states from Arizona to Nebraska. In addition to the fire risks and snow by the foot, the storm could also touch off severe thunderstorms, tornadoes and damaging hail. This causes billions of dollars in damages each year from Minnesota to Louisiana.
Fire Conditions Put Kansas to West Texas at Risk - Some of the worst fire conditions in a decade are going to sweep across Texas and the southern Great Plains, threatening key shale-oil fields, slaughterhouses and farms. Dry gusting winds and low humidity will create extreme fire weather from Kansas to West Texas, including Midland and Odessa, the U.S. Storm Prediction Center said. “This is one of the higher- end fire weather patterns we have seen in the last decade or so,” said Nick Nauslar, a government fire weather forecaster. Tuesday “is going to be a big day.” 2:06am CDT #SPC Day1 #FireWX Extremely Critical: parts of west texas and oklahoma into kansas. https://t.co/OIGmMBh3Nz pic.twitter.com/3WuneEgoof — NWS Storm Prediction Center (@NWSSPC) April 12, 2022 The central Plains and the western U.S. have been suffering from drought for months, leaving wheat crops parched of no rain. Ranchers may not have enough feed for their livestock. Almost 85% of Texas is in drought and more than 75% of Oklahoma is parched, according to the U.S. Drought Monitor. With grasses dried out and ready to burn, the warm dry winds could catch any flames in the area and send them spreading wildly. “It is a pretty good recipe for big fires and critical fire weather conditions,” Nauslar said. A powerful early spring storm is raking the southern U.S. with dry gusting winds, while dropping heavy snow. Blizzards across Montana may bring as much as 23 inches (58 centimeters) of snow. Red flag fire warnings cover parts of seven states from Arizona to Nebraska. In addition to the fire risks and snow by the foot, the storm could also touch off severe thunderstorms, tornadoes and damaging hail. This causes billions of dollars in damages each year from Minnesota to Louisiana.
Abandoned oil and gas wells spread out through New Mexico's Permian, San Juan basins - When oil and gas wells are shut down and abandoned, dangers to local communities and the environment linger. Both of New Mexico’s oil-producing regions: the Permian Basin in the southeast and San Juan Basin in the northwest have scores of inactive wells, per a recent study by the New Mexico Wilderness Alliance, and could be running afoul of state law. The Albuquerque-based environmental group, citing its own data on alleged inactive wells, called on the federal Bureau of Land Management to audit inactive oil and gas wells on federally-leased public land. The group hoped the audit would show if the wells identified in the Alliance’s study were in compliance, or not, with regulations. About 6,000 wells across the state were identified as not having produced oil or gas in the last year, per the study, including 2,600 on federal land. The study pointed to 100 wells it said hadn’t produced in 15 years. “Orphaned” wells with no active owner on file, wells that have expired approvals for temporary abandonment, and others with abandonment authorizations were listed in the study. In the Permian, the wells in question were scattered throughout Eddy, Lea and Chaves counties. In total, there were 68 orphaned wells and 16 wells with expired abandonment approvals, per the study. There were also 124 oil and gas leases provided to companies, accounting for 55,792 acres, in the area the study alleged were in violation of abandonment regulations at other facilities in the region.
A Hollow Boom for New Mexico -Our weak president threatens both America’s honor and freedom itself by pandering to dictators, limp Europeans and climate hoaxers in his drive to destroy the oil and gas industry with high gas prices. He and other politicians need to get out of the way of American oil and gas companies so they can get to work and drill, drill, drill us to energy independence.At least, that’s what some politicians and lobbying groups are saying. But numbers more complex than the gas station bottom line tell a decidedly different story, one corroborated by economists both in New Mexico and farther afield — and by oil and gas producers themselves.Producers have thousands of unused federal drilling permits — 1,040 in New Mexico alone. There are so many that President Joe Biden has threatened fines for not using them. Drilling rig counts haven’t followed increases in prices. Oilfield jobs in New Mexico are still down more than 20% since the COVID-19-triggered market collapse in March 2020. And perhaps most telling, in a survey of oil and gas producers conducted by the Dallas Federal Reserve Bank a month after the start of the Russian-Ukrainian war, the majority of producers said they had no plans to dramatically increase production in the next year.Oil and gas demand shot up in recent months for myriad reasons: Countries around the world have left COVID-19 lockdowns; those people are buying more stuff; companies have begun hiring as lockdowns end; OPEC hasn’t increased production as expected; and, yes, Russia started an unprovoked war in Ukraine, triggering widespread boycotts of Russian fuels and roiling international markets.Despite all of these triggers, in the U.S. — and particularly in New Mexico — oil and gas production hasn’t increased at the same pace as demand. Neither has oilfield hiring. And neither has the drill count. That leads to high prices for everything from gas to guavas — or anything else that needs to be transported — and that means turbulent financial markets and big profits for oil and gas companies. “They’ve done fairly well for themselves, let’s just say,” “There’s a lot more oil in the ground at $100 a barrel than there is at $10.” In other words, if oil prices go up, production will follow, as it becomes economically feasible to drill expensive, hard-to-reach deposits. It’s conventional wisdom that has held true for most of the past 50 years. But that isn’t happening with the current boom. In fact, oil production in New Mexico has leveled off as gas prices — and prices of everything else — have risen over the past six months. “Going back 150 years … there have been very few time periods where we’ve had stable oil prices.”
Rudolph, Arizona residents beat back SRP — Homeowners of a small Arizona town are celebrating a monumental victory Tuesday against the state’s second largest power company.The Arizona Corporation Commission voted 4-1 to reject a proposal by Salt River Project (SRP) to expand a gas power plant just outside the community of Randolph.The small, rural town sits about 60 miles southeast of Phoenix. Black farmworkers, denied opportunities to own land in existing cities, founded the community in the 1920s.As described by NBC News, the unincorporated community is economically depressed and prone to noise and pollution.About two dozen Randolph residents stood alongside environmental advocates Tuesday outside the Arizona Corporation Commission Phoenix facility to ask regulators to deny the proposed expansion of an SRP gas power plant on the outskirts of town.“It is a very inhumane act to allow 28 turbines to operate in our community,” said Mary Turner, a Randolph resident.Randolph homeowners argued that expanding the natural gas plant would only worsen existing problems.“The current system in place has failed the community of Randolph. Many residents have fled their homes for days to avoid vapors, odors, particulates,” said resident Jeff Jordan.During Tuesday’s hearing, commissioners voted 4-1 in favor of the town of Randolph.“I do not believe it is wise to put further pressure on this community to relocate. Their history is important,” said Commissioner Anna Tovar. ACC Commissioner Sandra Kennedy argued SRP rushed the planning process and did not collaborate enough with the Randolph community. SRP’s board approved the expansion in September of last year.
Biden admin restarts oil leases on federal land - The Biden administration announced today it will resume oil and gas leasing on federal lands under a revised program that includes a royalty rate hike to 18.75 percent.On Monday, the Bureau of Land Management will issue final environmental assessments and lease sale notices on 173 parcels covering 144,000 acres. The sales will incorporate many of the recommended reforms outlined in a November 2021 federal report, including analyzing the estimated greenhouse gas emissions that contribute to climate change and an increased royalty rate “to ensure fair return for the American taxpayer,” the Interior Department said.Interior said the reformed review process included “tribal consultation and broad community input” and resulted in whittling down the leasing area by 80 percent. “How we manage our public lands and waters says everything about what we value as a nation. For too long, the federal oil and gas leasing programs have prioritized the wants of extractive industries above local communities, the natural environment, the impact on our air and water, the needs of Tribal Nations, and, moreover, other uses of our shared public lands,” said Secretary Deb Haaland in a statement. “Today, we begin to reset how and what we consider to be the highest and best use of Americans’ resources for the benefit of all current and future generations.”President Joe Biden froze new oil and gas leasing shortly after taking office in January 2021. A federal judge overturned that moratorium last year, and Interior in 2021 conducted the first sale of the Biden era in the Gulf of Mexico (Energywire, June 16, 2021).The November report on the federal oil program called for an update to a royalty minimum set in 1920, as well as potentially new fees and tougher bonds. The minimum royalty rate is currently set at 12.5 percent (Energywire, Feb. 1).The White House has proposed a rulemaking for the federal leasing program, including a look at royalties, fees and bonding.The planned oil and gas lease sales announcement angered environmentalists, who blasted the Biden administration for not taking adequate action to address climate change.“The Biden administration’s claim that it must hold these lease sales is pure fiction and a reckless failure of climate leadership,” Randi Spivak, public lands director at the Center for Biological Diversity, said in a statement.The leasing plan did not impress the oil and gas industry. “While we’re glad to see BLM is finally going to announce a sale, the extreme reduction of acreage by 80 percent, after a year and a quarter without a single sale, is unwarranted and does nothing to show that the administration takes high energy prices seriously,” said Kathleen Sgamma, president of the Denver-based Western Energy Alliance.
U.S. Upstream M&A Going Strong With $14Bn In First Quarter Of 2022 - As the U.S. M&A market marched into the new year, $14 billion in deals were announced during the first quarter of 2022, Enverus, an energy data analytics company, said. The $6 billion transacted in January 2022 was the strongest M&A market launch in five years. However, the last significant transaction occurred in early March before a spike in commodity prices temporarily halted the activity. “All the factors that kept upstream deals resilient in 2021 carried over into the new year,” said Andrew Dittmar, director at Enverus. “That included a need for inventory by public companies, ready private sellers, and favorable pricing. However, the volatility in energy prices caused by Russia’s invasion of Ukraine stalled nearly all deals in March.” Overall, deals were most active in the Rockies region – more than 50 percent of the total first quarter of 2022 value-driven, particularly by buyer interest in North Dakota’s Williston Basin and Colorado’s DJ Basin. The always consistent Permian Basin captured a bit under 30 percent of deal value and one big deal in the Marcellus drove the roughly 20 percent of value allocated to the Eastern region. A lack of deals in the previously active Haynesville and a continued slow pace in the Eagle Ford meant transactions in Ark-La-Tex and the Gulf Coast were sparse. Private company exits remained a primary theme accounting for four of the five largest deals of the quarter. Chesapeake continued its buildout of core gas-focused inventory in the northeast Marcellus by acquiring private Chief Oil & Gas and associated Tug Hill interests in a $2.6 billion transaction. While that deal was more focused on building inventory runway and Chesapeake was willing to pay for it, other buyers like Earthstone Energy in the Midland Basin and PDC Energy in the DJ Basin sought acquisitions that could be purchased solely for the value of existing production while still adding future drilling locations.
Manchin floats ‘rebranded’ Keystone XL pipeline in visit to Canada -Swing vote Sen. Joe Manchin (D-W.Va.) floated the idea of a “rebranded” or “rerouted” Keystone XL pipeline during a visit to Canada on Tuesday. “The brand of the XL pipeline is probably gone,” Manchin told reporters when asked about the chances of a revival of the never-completed vessel. “Can it be rebranded, can it be rerouted, can it be these different things?”He added that it’s not clear whether the Biden administration “is going to entertain that” but added that “they’d be foolish not to.”During his first day in office, President Biden killed a key border-crossing permit for the Keystone XL pipeline, which would have transported Canadian tar sands oil to the U.S. In the years prior, the vessel had become a flashpoint in the environmental movement, as advocates raised concerns about the carbon intensity of the tar sands oil it would deliver, as well as tribal opposition. Proponents, meanwhile, have invoked energy security and construction jobs. Manchin’s latest comments also follow a Wall Street Journal report which said that the administration was looking for ways to import more Canadian oil after Russia’s invasion of Ukraine drove up fuel prices. Republicans, meanwhile, have ramped up their criticisms of the Keystone decision in recent weeks amid the high prices, even though the pipeline was only about 8 percent completed upon its cancellation last year.The company behind the pipeline, TC Energy, said in 2020 that the vessel would not have delivered oil until 2023.In the meantime, the U.S. has continued to import a significant amount of Canadian oil — which makes up more than half of the country’s oil imports.
Oil Worker Shortage Hits Canada --There is a shortage of oil and gas workers in Canada, according to the Canadian Association of Energy Contractors (CAOEC). “After years of sector instability and a recession, many workers pivoted to careers outside the oil and gas industry,” a CAOEC spokesperson told Rigzone. “In some cases, workers moved back home to other jurisdictions such as central Canada and Eastern Canada,” the spokesperson added. When asked about a solution to the problem, the CAOEC representative said Canadians “need to hear our good news story and ESG achievements”. “Signals of long-term recovery and positive messaging from leaders would help potential workers understand the many options and career prospects available in Canada’s energy sector,” the spokesperson added. According to a release in August 2021 by Statistics Canada, the country’s statistical office, the Canadian oil and gas industry employed over 72,800 workers in 2019. This was said to be down from approximately 89,600 workers in 2012, “when jobs in the industry peaked”. Last month, Hunter Kornfeind, the leader of Rapidan Energy Group’s U.S. crude production forecasting and analysis, noted that labor availability was tight and in short supply following the downturn due to Covid and said the U.S. oil and gas industry was not immune from those macro challenges. “The shortage is likely primarily due to workers not returning to the industry following the recession and crash in crude prices in 2020,” Kornfeind told Rigzone back in March. According to the Texas Independent Producers and Royalty Owners Association’s latest state of energy report, which was published in February, the U.S. oil and gas industry supported a total of 832,869 direct jobs in 2021. This figure was said to represent a net decline of 55,214 direct jobs compared to 2020.
Quebec passes law banning oil and gas production -- Questerre is sitting on an estimated Utica shale gas resource of some 6 trillion ft3 in Quebec's St Lawrence Lowlands. The government of Quebec passed Bill 21 on April 12, effectively banning oil and gas production in the eastern Canadian province and agreeing to provide C$100mn (US$79.5mn) in compensation to the industry, much less than the C$500mn requested.“We are incredibly disappointed that the government of Quebec has chosen to proceed with this legislation,” Questerre Energy CEO Michael Binnion said April 14. “By blocking the development of its natural gas resources with zero-emissions technology for export, Quebec is missing an important opportunity to work with other nations to provide secure, reliable energy for our European allies.”Quebec premier Francois Legault promised last year to ban oil and gas production in the province and followed through in February, when Bill 21 was tabled in the National Assembly.Questerre is sitting on an estimated Utica shale gas resource of some 6 trillion ft3 in Quebec’s St Lawrence Lowlands. That resource is now effectively stranded. Denying Questerre and other companies the opportunity to develop Quebec’s natural resources, Binnion said, leaves the province “highly dependent” on imported natural gas, oil and petroleum products. And it does nothing to reduce greenhouse gas emissions in Quebec or elsewhere.Bill 21 was passed by the National Assembly, and has received royal assent from the province’s lieutenant governor. It will come into force, in whole in part, at the government’s discretion following the finalisation of associated regulations, including the proposed compensation programme.“As we wait for Bill 21 to come into force, we will be assessing our legal options to preserve the rights of our shareholders,” Binnion said.
Extinction Rebellion Occupies Shell Headquarters In London - Environmental group Extinction Rebellion (XR) has occupied the London headquarters of oil supermajor Shell to demand a meeting with CEO Ben Van Beurden. Namely, three people have glued themselves to the reception desk and others are glued to the entrances outside. Outside the building, around one hundred people – members of XR’s whistleblowing platform TruthTeller – used placards with the name of an individual Shell employee and the words “Please Join Us.” This was an invite to Shell’s employees to share insider information about the company’s planet-damaging activities. Another group positioned a fireman’s trampoline below the office windows bearing the message: “Jump Ship.” TruthTeller also handed out flyers to Shell employees inviting them to join Extinction Rebellion, while there’s still time with a message to “switch to the right side of history before Shell turns toxic on your CV.” The flyer also invited staff to speak up and raise issues with corporate policy and behavior with colleagues and management, post-XR material on internal notice boards and common spaces, or anonymously share details about any of Shell’s climate-damaging plans via its online secure whistleblowing platform. A ‘nice touch’ so to speak was XR offering to fund several career coaching sessions for staff thinking of leaving Shell and moving to companies specializing in renewables. “As everyone knows, the fossil fuel industry’s social license is fast expiring. In a few short years, it will make the tobacco industry seem like an ethical choice. We’re here to help employees at Shell and all planet-damaging companies to either speak up internally, share insider information via TruthTeller, or jump ship – before it’s too late,” Zoe Blackler, coordinator of XR’s TruthTeller said.
‘There is nothing else out there’: why Europe is hooked on Russian gas -As outrage over the war in Ukraine grows, European leaders are under mounting pressure to expand sanctions against Russia and end the EU’s decades-long dependence on the country’s oil and gas once and for all. But an analysis of the top 10 global producers shows just how difficult it would be to remove Russian gas from the European energy mix without imposing stringent curbs on industrial consumption that could crush economic growth.The EU imports about 30 per cent of its oil and 40 per cent of its gas from Russia, paying Moscow roughly $850mn a day at current prices to keep the hydrocarbons flowing. Weaning Europe off Russian oil would be challenging. Getting rid of Russian gas would be harder. Gazprom, Russia’s biggest gas producer and monopoly exporter, towers over the global gas market. It produced 540bn cubic metres last year, more than BP, Shell, Chevron, ExxonMobil and Saudi Aramco combined, according to data from consultancy Wood Mackenzie. Of that, 331bn cubic metres were consumed in Russia and 168bn were piped to Europe. You are seeing a snapshot of an interactive graphic. This is most likely due to being offline or JavaScript being disabled in your browser. Giles Farrer, head of gas research at Wood Mackenzie, said replacing that volume would be “impossible” since production at most gas projects around the world was already running at close to maximum levels. “There is nothing else out there.” Unlike in the oil industry, where big producers such as Saudi Arabia have historically held back additional capacity to help balance the market in the event of a disruption to global supplies, the gas industry has tended to operate at or close to capacity. Gas is also less fungible than oil, since moving it from the point of production to the point of consumption requires a pipeline or liquefaction facility and therefore a bigger upfront investment, said Farrer. As a result, countries with significant gas reserves, such as Russia, have tended to develop large domestic markets before building export capacity. The Iranian national oil company, the largest gas producer after Gazprom, produced 291bn cubic metres in 2021. But 280bn of that was consumed in Iran, according to Wood Mackenzie’s data. The easing of sanctions on Iran in the event of a nuclear deal could reopen the possibility of broader international access to Iranian gas but would require new export facilities, which would take years to build. Other than Russia, the only suppliers of piped gas to Europe are Norway, Azerbaijan, Libya and Algeria, where state-owned Sonatrach sent 34bn cubic metres via pipelines to Spain and Italy last year. Algeria could increase that supply if it can resolve a diplomatic spat with Morocco that has blocked one of its routes to Spain since November, but it would first need to boost production and satisfy growing domestic demand, “If they can produce the gas and if it’s not consumed domestically in Algeria, there is spare export capacity,” “The trouble is bringing on the upstream in Algeria quickly.”
Climate questions mount as U.S. rushes LNG to Europe - — The promise and peril of America’s natural gas boom is readily apparent near the mouth of the Sabine River, where refinery stacks and lumbering gas tankers tower over a coastal plain of sweeping marshes pocked by hurricane damage. This ribbon of water, which separates Texas from Louisiana, is the beating heart of the U.S. liquefied natural gas industry. Last week, two tankers the length of three football fields were docked at a terminal on the Louisiana bank. One, bound for Poland, is capable of carrying enough gas to meet the country’s demand for an entire day. The other, recently returned from Asia, could fuel New York state for more than 24 hours. Two miles up river, on the Texas shore, a thicket of roughly 40 cranes marked the location where 4,000 workers were busy building a new $10 billion export terminal. Nearby, road crews were rerouting Texas Highway 87 to clear space for a third facility in development. The U.S. LNG industry has grown rapidly since the country shipped its first cargo in 2016. In December, America edged out Qatar to become the top LNG exporter in the world. Now, with Russia waging war in Ukraine and Asia’s growing economies hungry for energy, the world is demanding even more American LNG. President Joe Biden has promised to send more American shipments to Europe, as part of an E.U. effort to slash Russian gas imports to the continent by two-thirds. “When I was in office, we often talked about the importance of energy security, and its relation to national security,” said Dan Brouillette, who served as Energy secretary in the Trump administration and now leads Sempra Infrastructure, which operates one LNG terminal in Louisiana and is developing a second along the Sabine. “So to the extent that we can deepen ties with our European allies, with our Asian allies around energy, it’s good for them, it’s good for us and, I think, frankly, it’s good for the world.” Asia long has served as the top destination for American LNG, but recent months have seen U.S. shipments rerouted to Europe en masse. American LNG exports to Europe surged to 13.2 million metric tons during the first quarter of 2021, an increase of 143 percent over the same time period last year, according to Rystad Energy. But boosting U.S. shipments even more will be no easy task. The seven existing LNG export terminals today are almost maxed out. It is also unclear how long Asian customers will continue to forgo U.S. shipments. Asian buyers hold many of the long-term supply contracts with American exporters but recently have elected to send cargoes to Europe, where they can fetch a higher price (Climatewire, April 1). New export capacity, meanwhile, remains years away. Golden Pass, the $10 billion project being built here, is the only new terminal in advanced construction. About a dozen expansions and new projects have received federal permits but have yet to secure financing.
5 things to know about liquefied natural gas and its role in the Ukraine crisis --The Russian invasion of Ukraine has put a spotlight on the production and trade of liquefied natural gas (LNG), a key part of Russia’s energy leverage in Europe. Before the invasion, Russia was Europe’s third largest supplier of LNG after the U.S. and Qatar, accounting for 20 percent of imports, according to the U.S. Energy Information Administration. In March, following the invasion, the Biden administration announced a deal to increase LNG exports to the EU to cover about one-third of imports from Russia. The U.S. already led in LNG exports to Europe in 2021, providing 26 percent of its imports. The U.S. export of these resources to Europe were on the rise even before the Russian invasion. They saw an increase of 3.4 billion to 6.5 billion cubic feet a day between November 2021 and January 2022. Russia is “a fairly new player” in the LNG industry, Cahill said, but already has two major projects. The first, the Yamal LNG project, is set to carry 16.5 million metric tons of LNG from the port of Sabetta on Russia’s Yamal Peninsula. The second, Arctic LNG 2, was set to launch in 2023 with a projected production capacity of nearly 20 million metric tons. However, a number of international investors pulled out of the project after Russia invaded Ukraine, including the government of Italy, which froze its share of the financing. Japan and France followed suit shortly afterward. Despite the U.S. stepping up LNG imports to Europe, experts said at a certain point there’s not much more that can be done on the supply side. “The United States is exporting every molecule of natural gas we possibly can,” Samantha Gross, director of the Brookings Institution’s Energy Security and Climate Initiative, told The Hill. “Our LNG facilities that we have are going full out … not because any politician told them to but because high prices encourage that.” The administration’s vow to increase exports to Europe, she said, may run up against the fact that “producers are producing everything they can and selling it to the market where they have contracts in the market where they’re getting the best price,” she said. As a result, she said, to meet commitments to increase supply to Europe, there may “have to be some arm-twisting, and maybe encouraging buyers and other countries should reduce their demand,” she said. “There’s not a ton of extra LNG capacity just sitting there waiting to supply Europe.” With a finite supply of American LNG to export, some of the extra sent to Europe will be diverted from Asia. “If you have a cold winter next year in Northeast Asia, places like China, Japan and South Korea, the gas demand will be strong and those LNG cargoes will be needed there,” Cahill said. Many of the buyers in Asia have long-term contracts that allow diversion to other markets. However, “if the buyers need those [imports], they’re going to stay in Asia, and to bid them away from Asia towards Europe, they’ll need very high prices,” Cahill said. Advocates for renewable energy have called the Ukraine crisis, and the corresponding spike in gas prices, a further incentive to transition off of fossil fuels. However, many of them have been dissatisfied with the emphasis on natural gas, which is predominantly methane, one of the most damaging greenhouse gases. Methane is about 25 times more effective at trapping heat in earth’s atmosphere as carbon dioxide, and many advocates have pointed to cutting methane as a quicker way to reduce emissions.
The European Union Demand Response to High Natural Gas Prices - European gas markets are in turmoil. Supplies from Russia in the first quarter of 2022 (289 terawatt hours) were 30% lower than the same period of 2021 (408 TWh). Policymakers in both Russia and the European Union are discussing the possibility of a complete stop to Russian gas flows to the EU. Markets are extremely nervous, resulting in a six-fold gas price increase in the first quarter of 2022 compared to one year earlier (Figure 1).High EU gas prices (and benign global market conditions) saw the EU import 305 TWh of liquefied natural gas (LNG) in the first quarter of 2022, compared to 170 TWh a year previously (see tracker). But high prices have not only lured new gas supply into Europe. They have also encouraged consumers to reduce gas demand significantly. We estimate a 7% drop in Q1 2022 compared to Q1 2021 (1402 TWh versus 1507 TWh; see Annex 1). This can only partly be explained by milder weather.Anecdotal evidence suggests high prices have led industrial companies to reduce natural gas consumption, but it is not clear by how much. National and sectoral natural gas demand data is not made available in a timely manner, and we can offer only partial evidence (see below) suggesting EU industrial gas demand has fallen by around a fifth.Gas-to-coal switching in the EU power sector has not contributed to reduced demand as gas-fired generation was actually up by 4TWh in Q1 2022 compared to 2021, because of lower nuclear and hydro production (Figure 2).This implies that household and other gas demand (including services and non-individual household heat generation) in Q1 2022 was about 5% lower than one year previously (Figure 3). If the goal is to replace Russian gas entirely, this is a promising start, as Russia invaded Ukraine near the end of the first quarter of 2022 and so far, the EU and its members have not introduced strong energy-saving policies. On the contrary, national policies in response to rising energy prices have focussed on cutting taxes, boosting demand. We showed previously that with stronger policies, savings of roughly 20% of total demand could be achieved. Our industrial reduction estimate is based on data from the European Network of Transmission System Operators for Gas (ENTSOG) (Figure 4, Annex 2). This shows in Q1 2022, weekly industrial demand for natural gas in Italy was 0.25TWh/week below 2021 levels; in Belgium, it was 0.3 TWh/week lower; in Luxembourg 0.1 TWh/week lower; and in the Netherlands 1.3 TWh/week lower. In total, these demand reductions suggest a 20% drop compared to 2021 levels. As industrial demand comprises 25% of EU total demand, a 20% annual reduction in industry demand across all countries would result in a 5% reduction in total gas demand. Data available for the UK show a weekly drop of 0.35 TWh/week. A shift in trade flows further highlights declining demand from EU industry for natural gas over the past few months. One of the factors in decreasing EU industrial gas consumption is that energy-intensive products are exported less and/or imported more when natural gas and electricity prices are high (Figure 5). Natural gas is the key input for production of chemicals and ammonia. In December 2021, EU ammonia imports amounted to €250 million compared to €96 million in June 2021 (Figure 3). Some of this effect is driven by prices but not all. We estimate a 27% increase in ammonia imports in December compared to June. Imports of aluminium, for which electricity is a key input to production, have also responded to high power prices. In December 2021, EU aluminium imports were worth €2 billion, while in December 2020 they were €1.2 billion. Accounting for price effects, we estimate a 35% increase in physical imports. Iron and steel imports grew throughout the second half of 2021, and were approximately €2 billion higher in October compared to June, but in November they dropped off.
Europe turns to Middle East, Mediterranean to reduce its dependence on Russian gas – As the war in Ukraine rages on, leaders of European countries, notably Germany, have come to realize that they made a serious mistake by becoming so dependent on Russian energy. Currently, Europe depends on Russia for roughly 40 percent of its natural gas needs, and European leaders have vowed to reduce their dependence by two-thirds. So, European countries are feverishly trying to secure supplies from the Middle East and the Mediterranean. Energy security has become one of Europe’s top priorities, putting on the back burner the fight to contain climate change and global warming. Of course, the gas and oil-rich Gulf Cooperation Council (GCC) members were the first countries which European leaders requested to cover the energy shortfall to be created by a future removal of Russian gas and oil from the scene. However, GCC countries say that they are unable to significantly increase their hydrocarbon exports to Europe, due to production constraints and the fact that most of their future production is locked in long-term contracts with their clients in Asia. In the past few weeks, Germany, the United States and the United Kingdom sent senior representatives to Saudi Arabia and the United Arab Emirates, which are major hydrocarbon producers, asking them to increase energy supplies, but their requests fell on deaf ears. Qatar was the only country that offered some help when it diverted to Britain and Belgium six LNG tankers that were originally destined for Asia and indicated that it would increase its gas production to cover part of the shortage. The emirate of Qatar currently supplies about 30 per cent of its liquefied gas to the European Union, but none of this goes to Germany, because it does not have LNG terminals. To correct this situation, Germany is fast-tracking the construction of two LNG terminals, but these will become operational in three years’ time.
OMV Petrom ceased importing Russian crude oil --OMV Petrom, the largest energy company in Romania, no longer buys crude oil from Russia for consumption at the Romanian refinery, company officials officials told Economica.net. Even if it is going to be more expensive, OMV Petrom will seek to buy crude oil from other sources. By its decision, OMV Petrom follows a trend of an informal ban on Russian oil that will probably soon become formal in Europe - after such a ban was enacted in the United States, United Kingdom, Canada and Australia. While sanctions on Russian natural gas are unlikely at this point because of the economic damage they would cause, Europe could better withstand an embargo on Russian oil. "We have chosen not to process crude oil from Russia. We bring non-Russian crude oil, it may originate from ex-Soviet republics - but not Russia. We also look to North or West Africa [for oil supplies]. We also have the offer of crude oil from Kazakhstan on the table. But all purchases are made through our London office (OMV Trading), which looks at all options for purchases," said Radu Căprău, a member of Petrom's management responsible for refining and marketing. "Russian oil would have been delivered at a discount, but we are not buying. It is our way of sanctioning Russia. It was our decision and that of the OMV group, they are going in the same direction as well," the official explained.
Asian LNG prices dip as European gas maintains premium --Asian spot liquefied natural gas (LNG) prices fell this week as China imposed COVID-19 lockdowns, while European gas prices rose, maintaining their premium to attract cargoes to the region amid risks of Russian gas supply cuts. The average LNG price for May delivery into north-east Asia was estimated at around $33.00 per metric million British thermal units (mmBtu), down $2.00 from the previous week, industry sources said. The May Dutch gas price at the TTF hub, the European gas benchmark, is around $34.50/mmBtu, still at a premium to Asian spot LNG to attract cargoes. The European gas market remains concerned that flows of Russian gas, which accounts for some 40% of its supplies, could stop later this month amid a stand-off over a demand for payment in roubles and worries over possible sanctions. Europe continues to dominate U.S. LNG exports, which rose nearly 16% last month to a record high, according to preliminary Refinitiv data. Europe last month took about 65% of U.S. exports, with about 12% going to Asia. Analysts said more U.S. LNG exports are needed, with European inventories about a quarter full, below the five-year average of about 34% for this time of year. With U.S. LNG plants producing LNG at full capacity, most of the additional gas going to Europe would have to come from exports intended for other parts of the world, analysts said. Two U.S. companies have said they will add production capacity. New Fortress Energy Inc proposes to build an offshore LNG export project, while Sempra Energy has agreed to increase the capacity of its Cameron LNG Phase 2 project. In Asia, China’s spot LNG import quotes were pegged at $30.44/mmBtu for May arrivals, compared to $35.13/mmBtu a week earlier, according to the Shanghai Petroleum and Natural Gas Exchange. Chinese authorities on Tuesday extended a lockdown in Shanghai to cover all of the financial centre’s 26 million people. Japan has delayed the restart of a 870 megawatt nuclear reactor which was supposed to come back online on May 22, and some other outages have been prolonged, analysts said. “Japanese utilities also seem to have significantly lower storage inventories at the end of March compared to last year,” Stocks would have to increase by up to 800,000 tonnes in the next three months to reach the same level as June 2021, he added. “Japan’s LNG demand is looking higher than previously thought, which will come at the expense of gas availability to other parts of the world. Japan also said on Friday it would ban coal imports from Russia in a broad escalation of sanctions, which could lead to more LNG buying.
Ukraine calls on commodity traders to stop handling Russian oil -- The Ukrainian government has called on some of the world’s largest energy traders to stop handling Russian crude, of which the companies have discharged more than 20mn barrels since the outbreak of war. Vitol, Trafigura, Glencore and Gunvor have continued to lift large volumes of Russian crude and products including diesel, according to ship tracking and port data. Oleg Ustenko, economic adviser to Ukrainian president Volodymyr Zelensky, wrote to the four companies at the end of March demanding that they stop trading Russian hydrocarbons immediately since export revenues are funding Moscow’s purchase of weapons and missiles. “The fact is that traders are trading and they are helping Russia to receive this blood money,” Ustenko told the Financial Times. “They are in this cycle of financing war crimes and genocide against Ukrainian citizens.” Russian exports of crude oil, refined products and gas to Europe alone are estimated to be providing Moscow with $850mn a day and have led Russia to a record current-account surplus, according to data from the Bruegel and the International Institute of Finance think-tanks. Images of civilian deaths have prompted Ukrainian leaders to accuse Russia of war crimes, a claim Moscow denies. While Russian oil and gas are not directly under EU sanctions, refiners, insurers, banks and shipping companies are “self-sanctioning” because of the risk of breaches or of tarnishing their reputations. Oil traders have a lower profile than energy companies such as BP and Shell, which have powerful marketing businesses that also trade Russian oil. However, they form an essential part of the infrastructure that allows commodities to flow around the world. Between the start of the war in Ukraine and the end of March, Glencore, Vitol, Trafigura and Gunvor discharged 33 tankers carrying roughly 20mn barrels of crude and oil products loaded at Russian ports, according to an analysis of Refinitiv data by Global Witness, a lobby group, reviewed by the Financial Times. The figures include oil produced in Kazakhstan and Turkmenistan but shipped from Russian ports. At the FT Commodities Global Summit last month, the bosses of the world’s biggest commodity traders said they have frozen investments and stopped taking new business in Russia but planned to keep fulfilling their obligations to take oil under legally binding long-term contracts, which have not been placed under sanctions. Asked for comment on Ustenko’s letter, all the trading companies said they unequivocally condemned the war in Ukraine. In a statement, Vitol said it would not enter into any new Russian oil transactions and “intends to cease trading Russian origin crude oil and product, unless directed otherwise”. “Volumes of oil will diminish significantly in the second quarter as current-term contractual obligations decline, and we anticipate this will be completed by end of 2022,” it said. Vitol said it was working with its consortium partner to find a “mutually acceptable solution” for the stake it holds in Vostok, a giant Arctic oil project being developed by Rosneft, the state-backed Russian oil producer. Trafigura said it was purchasing lower volumes of Russian oil than before the invasion. “We are not developing any new oil and gas business in Russia,” it added. Gunvor said it was legally obliged to fulfil existing trading contracts, which are not hit with sanctions. “No new business is being conducted,” it said. Glencore said it would not enter any new trading business in respect of Russian commodities. At least 2.5mn of Russia’s 4.6mn barrels a day of crude exports in 2021 were sold under long-term contracts with 1.4mn b/d of those sent to Europe, according to research by JPMorgan. Russian crude exports dropped to 3.1mn b/d in the second half of March, down from 3.5mn b/d in the first half of the month, data from commodity analysis group Kpler show. However, the traders have not disclosed the volume of oil they must take under their contracts. Under some Russian contracts, traders are legally bound to lift volumes nominated by the seller.
Eni Makes Oil And Gas Discoveries In Egypt Western Desert - Italian oil major Eni has made new oil and gas discoveries in the Meleiha concessions in Egypt’s Western Desert, for approximately 8,500 barrels per day of oil equivalent. Eni said that these discoveries have already been connected and tied into production, in line with the infrastructure-led exploration strategy, allowing to maximize exploration opportunities nearby existing infrastructures. The results were obtained through Nada E Deep 1X well, which encountered 195 feet of net hydrocarbon pay in the Cretaceous-Jurassic Alam El Bueib and Khatatba formations, Meleiha SE Deep 1X well, which found 100 feet of net hydrocarbon pay in the Cretaceous-Jurassic sands of the Matruh and Khatatba formations, and Emry Deep 21 well, which encountered 115 feet of net hydrocarbon pay in the massive Cretaceous sandstones of Alam El Bueib. These results, added to the discoveries of 2021 for a total of 8 exploration wells, give a 75 percent of success rate, confirming the potential of the area. Other exploration activities in the concession are ongoing with promising indications. With these discoveries, Eni, through AGIBA – a joint venture between Eni and Egyptian General Petroleum Corporation, continues to successfully pursue its near field strategy in the mature basin of the Western Desert, aimed at maximizing production by containing development costs and minimizing time to market. Eni also renewed its commitment to the Western Desert with the recent acquisition of two exploration blocks with the planning in 2022 of a new high-resolution 3D seismic survey in the Meleiha concession, also aimed at investigating the gas potential of the area, in line with the energy transition goals. This week, Eni and the Egyptian Natural Gas Holding Company agreed to maximize Egypt’s gas production and LNG exports. Eni said that the agreement aims to promote Egyptian gas export to Europe, and specifically to Italy, in the context of the transition to a low carbon economy.
UN unveils plan to prevent stricken oil tanker disaster off Yemen coast -- Critical funding and timely action are needed to prevent a decaying tanker anchored close to Yemen’s coastline from sparking a major oil spill, the UN Humanitarian Coordinator for the country said on Friday in New York. David Gressly outlined plans to address the threat posed by the FSO Safer, described as a time bomb sitting off Yemen’s Red Sea coast. The 45-year-old floating storage and offloading (FSO) facility holds 1.1 million barrels of oil, or four times the amount of the Exxon Valdez – the tanker that caused one of the greatest environmental disasters in United States’ history. It is at imminent risk of spilling a massive amount of oil due to leakages or an explosion. “If it were to happen, the spill would unleash a massive ecological and humanitarian catastrophe centered on a country already decimated by more than seven years of war,” said Mr. Gressly. The FSO Safer has been moored some 4.8 nautical miles south west of the Ras Issa peninsula on Yemen’s west coast for more than 30 years. Production, offloading and maintenance ceased in 2015 due to the conflict between a pro-Government Saudi-led coalition, and Houthi rebels, and the vessel is now beyond repair. Mr. Gressly warned that a significant spill would have devastating consequences for Yemen and beyond. Some 200,000 livelihoods in the already war and crisis-wracked country could be instantly wiped out, and families would be exposed to life-threatening toxins. “A major oil spill would likely close, at least temporarily, the ports of Hudaydah and Saleef,” he added, referring to critical entry points for food, fuel and supplies. The disaster would have a severe environmental impact on water, reefs and life-supporting mangroves. Saudi Arabia, Eritrea, Djibouti and Somalia are also at risk. Clean-up alone would cost $20 billion. “That does not count the cost of environmental damage across the Red Sea. Or the billions that could be lost due to disruptions to shipping through the Bab al-Mandab Strait, which is also a passageway to the Suez Canal,” Mr. Gressly told journalists.
UN seeks $80 million to prevent ′imminent′ Yemen oil spill = The United Nations is seeking nearly $80 million from donor nations for an emergency operation to remove a million barrels of crude oil from a tanker anchored off the coast of war-ravaged Yemen and avert a catastrophic oil spill in the Red Sea. FSO Safer is a 45-year-old vessel that was sold to Yemen in the 1980s and has been used as a floating oil storage platform. It has 1.1 million barrels of crude oil on board. Since 2015 the tanker has been moored off the Yemeni port city of Hodeida — held by Houthi rebels — without being serviced. UN warns of ecological 'time bomb' David Gressly, the UN resident and humanitarian coordinator for Yemen, said on Friday that the tanker is "a time bomb" because a major oil spill "would unleash a massive ecological and humanitarian catastrophe centered on a country already decimated by more than seven years of war.'' "Without funding over the next six weeks or so the project will not begin on time, and this time bomb will continue to tick,'' he added. There are fears that the tanker could explode or leak causing a major environmental disaster in the Red Sea and beyond. Following years of talks, the United Nations and Yemen's Houthi rebels signed off on a memorandum of understanding in March this year, authorizing a four-month emergency operation to tackle the immediate risk which involves transferring oil on the Safer tanker to another vessel. The MOU, in the long term, urges replacing the tanker with another vessel within 18 months.
DOE grants exploration contract for Cotabato Basin -The Department of Energy (DOE) has issued a petroleum service contract to SK Liguasan Oil and Gas Corporation (SKLOGC) to develop the Cotabato Basin, which includes the Liguasan Marsh. According to a Manila Standard report, Energy Sec. Alfonso Cusi confirmed the signing of Service Contract (SC) 77 last week. Cusi had endorsed the contract to the Office of the President for final approval, which then allowed the DOE to proceed with the awarding of SC77 “provided that SKLOGC shall submit an undertaking stating, among others, that it shall abide by the final decision of the Supreme Court relative to tax assumption provisions of other existing [petroleum service contracts].” SC77 covers a 72,000-hectare petroleum-prospective area in the onshore Cotabato Basin, which sits on a 1.2-million hectare area in Sultan Kudarat, Maguindanao, and North and South Cotabato. Together, the four provinces comprised most of the old Cotabato province during the American colonial and postwar periods. SKLOGC was the challenger for the nominated Area 9 of the Philippine Conventional Energy Contracting Program (PCECP) that was launched by the DOE in 2018 to “encourage stakeholders to invest, explore, develop and produce Philippine indigenous energy resources.” SKLOGC was able to identify 22 sites within the SC77 area to have the potential for oil and gas deposits.
Nigeria Records $1.86bn Oil Export To India In Q4 = India has remained one of the largest export markets for Nigeria, as report showed Nigeria exported crude oil worth N774.5 billion or ($1.86 billion) to India in the fourth quarter of 2021. According to Nigeria Bureau of Statistics(NBS) report, crude oil was followed by exports of liquefied natural gas at N89.8 billion and liquefied petroleum gas otherwise known as cooking gas at N6.7 billion to India. India remains one of the largest export markets for Nigeria and accounted for 15.2 per cent of total exports in the quarter, amounting to N874.9 billion, it said. The NBS said Spain ranked second in the fourth quarter, with exports to the European country valued at N789.2 billion. Crude oil was the largest exported commodity to Spain worth N624 billion in the quarter. Nigeria exported liquefied natural gas worth N159.8 billion to Spain in the fourth quarter, it said. ADVERTISEMENT Also, Nigeria exported crude oil worth N383.6 billion to the Netherlands in the same quarter, according to NBS. Nigeria is Africa’s largest crude exporter. Oil exports account for more than 90 per cent of the country’s foreign exchange earnings and 70 per cent of government revenue, according to the International Monetary Fund. YOU MAYLIKE
India's fuel demand rose 4.2 per cent in March: Oil ministry data -- India's fuel demand rose 4.2% in March compared with the same month last year, data from the Petroleum Planning and Analysis Cell (PPAC) of the oil ministry showed on Monday. Consumption of fuel, a proxy for oil demand, totalled 19.41 million tonnes. Sales of gasoline, or petrol, were 6.2% higher from a year earlier at 2.91 million tonnes. Cooking gas or liquefied petroleum gas (LPG) sales increased 9.9% to 2.48 million tonnes, while naphtha sales fell 13.2% to 1.11 million tonnes. Sales of bitumen, used for making roads, were 11.6% lower, while fuel oil use advanced 14.4% in March.
Petrol, diesel prices hiked by 80 paise; total increase now stands at Rs 9.20 per litre --Petrol and diesel prices were on Tuesday hiked by 80 paise a litre each, taking the total increase in rates in the last two weeks to Rs 9.20 per litre. Petrol in Delhi will now cost Rs 104.61 per litre as against Rs 103.81 previously, while diesel rates have gone up from Rs 95.07 per litre to Rs 95.87, according to a price notification of state fuel retailers. Rates have been increased across the country and vary from state to state depending upon the incidence of local taxation. This is the 13th increase in prices since the ending of a four-and-half-month long hiatus in rate revision on March 22. In all, petrol and diesel prices have gone up by Rs 9.20 per litre.
IEA Cuts Oil Demand Forecast - The International Energy Agency cut its forecast for global oil demand this year after China reimposed lockdowns to contain the spread of a resurgent coronavirus. With the weaker demand outlook and the massive release of emergency oil reserves by IEA members, the agency now sees global markets in balance for much of the year. Crude prices have already lost most of their gains since Russia’s attack on Ukraine, to trade near $100 a barrel in New York on Wednesday. “We’re seeing now that economic forecasters are continuing to downgrade their outlook for the world economy, and obviously this will have an impact on oil demand,” Toril Bosoni, head of the IEA’s markets and industry division, said in a Bloomberg Television interview. “The market does look more balanced.” The Paris-based agency, which advises most major economies, lowered projections for world fuel consumption this year by 260,000 barrels a day, with a particularly steep reduction of 925,000 a day for China in April. Still, global demand remains on track to increase this year. The IEA also dialed back estimates for the loss of Russian supplies from an international boycott over its military aggression. Production in April may be 1.5 million barrels a day lower than the prior month -- roughly half the drop that was previously expected. Those losses may still double in May, the IEA said. Oil surged well above $100 a barrel following Russia’s attack on its neighbor. While prices have eased, they are still high enough to stoke inflationary pressures and exacerbate a cost-of-living crisis for millions of consumers. To counter this, IEA members announced last week that they will deploy 240 million barrels from emergency reserves, the biggest stockpile release in the agency’s history. China’s Outbreak “Prices are now back to near pre-invasion levels, but remain troublingly high and are a serious threat for the global economic outlook,” the IEA said. World oil consumption will expand by 1.9 million barrels a day to average 99.4 million a day this year, according to the IEA. “Oil demand is still recovering from Covid,” said Bosoni. “The aviation sector is recovering, there’s pent-up demand, so we are expecting growth. But obviously downside risk if the economic outlook deteriorates.”
Crude oil futures tumble on concerns over China COVID-19 spread, SPR release -Crude oil futures tumbled in mid-morning trade in Asia April 11 due to growing concerns over China's battle against a COVID-19 surge and the oil reserve release from consuming nations. At 10:21 am Singapore time (0221 GMT), the ICE June Brent futures contract was down $2.75/b (2.68%) from the previous close to $100.03/b, while the NYMEX May light sweet crude contract fell $2.76/b (2.81%) at $95.50/b. "Oil price gains still feel limited amid China's COVID-19 concerns and global recession worries in the face of more hawkish central bank policies," said SPI Asset Management Managing Partner Stephen Innes in an April 11 note, adding that the emergency oil reserve release by the International Energy Agency also weighed on prices. Meanwhile, COVID-19 cases continued to grow in Shanghai, currently the epicenter of the outbreak in China. There were 914 symptomatic cases and 25,173 asymptomatic cases in the city as of April 10, the local government said on its official WeChat account April 11, making for a fresh record high of 26,087 cases in total. In a grim portent for oil demand in the world's second largest oil consumer, authorities in other cities, including Ningbo and Beijing, have begun implementing limited restrictions to curb the spread of the virus, according to media reports. The latest developments will add to growing worries over the outlook for oil, coming after the US, followed by the IEA, announced over the last two weeks oil reserve releases totaling around 240 million barrels over the next six months. Dubai crude swaps were lower in mid-morning trade in Asia April 11 from the previous close, though intermonth spreads were higher. The June Dubai swap was pegged at $94.74/b at 10 am Singapore time (0200 GMT), down 58 cents/b (0.61%) from the April 8 Asian market close. The May-June Dubai swap intermonth spread was pegged at 87 cents/b at 10 am, up 8 cents/b over the same period, and the June-July spread was pegged at 71 cents/b, up 13 cents/b. The June Brent/Dubai EFS was pegged at $5.83/b, down 43 cents/b.
Oil drops, Brent crude falls below $100 as China lockdowns spark demand fears - Oil prices slid Monday, falling to the lowest level since February and building on two straight weeks of declines as lockdowns in China sparked demand fears. International benchmark Brent crude fell 4.18% to end the session at $98.48 per barrel, the first settle under $100 since March 16. West Texas Intermediate crude futures declined 4.04% to settle at $94.29. During the session the contract traded as low as $92.93, a price not seen since Feb. 25. "The spread of Covid in China is the most bearish item affecting the market," China is the world's largest oil importer, and the Shanghai area consumes roughly 4% of the country's crude, according to Lipow. The potential hit to demand comes as the supply side of the equation has been front and center given Russia's role as a key oil and gas producer and exporter. Last week the International Energy Agency announced that its member countries would release 120 million barrels from emergency stockpiles, of which 60 million barrels would be from the U.S. The announcement followed the Biden administration saying it would release 180 million barrels from the Strategic Petroleum Reserve in an effort to alleviate soaring prices. WTI fell 1% last week while Brent declined 1.5%, with both contracts posting their fourth negative week in the last five. Oil prices have been on a roller-coaster ride since Russia invaded Ukraine. WTI briefly traded as high as $130.50 on March 7, the highest level since July 2008. The contract has fallen nearly 30% since. Brent meantime spiked to $139.13 in March. Part of the move is thanks to fears over what a disruption in Russian supply would mean for an already tight market. The IEA previously predicted that three million barrels per day of Russian oil output was at risk. Traders also attributed oil's wild swings to non-energy market participants exchanging contracts as a way to hedge against inflation, among other things. Still, Wall Street firms were quick to point out that tapping emergency oil stockpiles will alleviate the price spike in the near-term, but doesn't address the fundamental issues in the market. "[S]ome of the market tightness caused by the self-sanctioning of Russian crude buyers — either in fear of future sanctions or for reputational reasons — should ease," UBS wrote in regards to the emergency releases. "But it will not fix the the oil market's structural imbalance resulting from years of underinvestment at a time of recovering global demand," the firm added.
Oil Slides on Lockdowns, Announced Releases From Reserves -- Oil futures settled Monday's session with sharp losses spearheaded by tightening lockdowns of China's largest cities and flagging fuel demand on the back of the largest COVID-19 outbreak since beginning of the pandemic, as well as announced reserve releases from the International Energy Agency and the United States that eased concerns over near-term supply shortages on the global market. China's producer price index, which measures factory inflation, increased 8.3% on annual basis, according to the government data released Monday, threatening to exacerbate rising prices for manufactured goods worldwide. China's consumer price index, which tracks the cost of everyday goods and services, also rose above expectations, albeit by a modest 1.5%, year-on-year, compared with 0.9% in February. Rising prices for everyday goods and services highlight rising challenges for the world's second largest economy that is struggling to control the latest COVID-19 outbreak. China's Premier Li Keqiang warned Monday that China will have to step up imports of food to replenish its stockpiles in the coming months, which is going to put additional pressure on global inflation. "Economic pressures are increasing. Because of lockdowns, food prices are going to rise further," he added. The World Bank slashed China's 2022 growth forecast, estimating gross domestic product would grow 5% this year, down sharply from last year's 8.1% expansion rate. That's also lower than China's official target of about 5.5%. China's largest COVID-19 outbreak since the beginning of the pandemic continues to spread despite extended lockdown of Shanghai's 25 million people, with restrictions weighing on its economy and straining global supply chains. Cases of COVID-19 in Shanghai have surged to 130,000 as of Monday, raising fears that the lockdown of China's largest city would continue. The lockdowns are prompting canceled flights and movement restrictions that could cut 1.2 million to 1.3 million barrels per day (bpd) of oil demand, according to estimates from Commerzbank. Underlining recent gains for the oil complex, Russia's crude production is expected to suffer a heavy blow from the Western sanctions that have already shaved off between 4% and 5% from Russian oil production, according to Russia's Deputy Prime Minister Alexander Novak. On the session, NYMEX May West Texas Intermediate futures fell below $95 barrel (bbl), down $3.97 from Friday's settlement to $94.259 bbl, and the ICE June Brent contract declined $4.30 to $98.48 bbl. NYMEX May RBOB futures fell 12.85 cents to $3.0031 gallon and NYMEX front-month ULSD dropped 4.99 cents to $3.2677 gallon.
Oil Gains After OPEC, EIA Lower Global Supply Outlook -- Oil futures rallied in afternoon trade Tuesday after the Organization of the Petroleum Exporting Countries and the U.S. Energy Information Administration downgraded the global supply outlook through 2023, driven by sharp revisions to Russian oil production, which has been hammered by the sanctions levied by Western governments since Vladimir Putin's invasion of Ukraine on Feb. 24. In its Short-term Energy Outlook released Tuesday afternoon, EIA forecast Russian oil production would fall by 1.7 million barrels per day (bpd) from February through the end of 2023. Russia's oil production averaged 11.23 million bpd in March, according to OPEC's secondary sources, some 500,000 bpd below February's output rate. Private surveys, however, peg Russian output a tad above 10 million bpd. Such a staggering loss of Russian barrels is bound to weigh on the global supply outlook in the near-term while further supporting oil prices. Accelerated growth in U.S. oil production, seen at 12 million bpd this year, could only partially offset the expected decline in Russia's output. On the demand side, OPEC and EIA sharply cut global fuel consumption through 2023, citing renewed weakness across developing countries and the COVID outbreak in China. OPEC shaved 500,000 bpd off global demand projections for this year for demand growth of 3.7 million bpd, mostly reflecting the downward revision in world economic growth expectations. EIA made a more aggressive call on demand destruction, cutting 2022 consumption expectations by 810,000 bpd from the previous month's outlook. The sharp revisions in the outlooks come against a backdrop of surging inflation in the United States and elsewhere. The Department of Labor reported Tuesday morning that the U.S. consumer price index climbed 1.2% from February to March, bringing the annualized rate of inflation to the highest level since 1982 at 8.5%. Rising consumer prices have been unrelenting, with six straight months of inflation above 6%, which is well above the Federal Reserve's 2% target. Internationally, China's producer price index, which measures factory inflation, increased 8.3% on an annual basis, according to government data released on Monday, threatening to exacerbate rising prices for manufactured goods worldwide. China's Premier Li Keqiang warned on Monday that China would have to step up imports of food to replenish its stockpiles in coming months, which is going to put additional pressure on global inflation. On the session, NYMEX May West Texas Intermediate futures advanced $6.31 to $100.60 bbl, and the ICE June Brent contract rallied $6.16 to $104.64 bbl. NYMEX May RBOB gained 15.07 cents to $3.1538 gallon, and May ULSD jumped 19.67 cents to $3.4644 gallon.
OPEC tells EU that Russia oil crisis is beyond its control— OPEC’s top diplomat told European Union officials that the current crisis in global oil markets caused by Russia’s invasion of Ukraine is beyond the group’s control. Russian oil supply losses stemming from current and future sanctions or a boycott by customers could potentially exceed 7 million barrels a day, OPEC Secretary General Mohammad Barkindo said on Monday. That would be far beyond the group’s capacity to replace, he told EU Energy Commissioner Kadri Simson, who had asserted the cartel’s responsibility to balance the market. Simson said that the oil-producers group could tap its existing spare output capacity to assist in the crisis, according to an OPEC document seen by Bloomberg. Barkindo said that markets are being swayed by political factors rather than supply and demand, leaving little for the organization to do. “These crises have compounded to create a highly volatile market,” Barkindo said, according to the text of his opening remarks. “I must point out, however, that these are non-fundamental factors that are totally out of our control at OPEC.” Oil prices continue to trade near $100 a barrel as many refiners shun Russian supplies following the attack on its neighbor. The price rally has bolstered fuels like diesel, adding to the inflationary pressures and cost-of-living crisis hitting many consumers. OPEC nations such as Saudi Arabia have rebuffed calls from major consumers like the U.S. to fill in the gap left by Russia. Besides their view of the market, the kingdom and its allies may have other reasons for holding back. Riyadh jointly leads an alliance of global producers with Moscow known as OPEC+, and may also be keen to preserve its political ties with the Kremlin, which have helped the Saudis lessen their reliance on the U.S.
Oil settles up on Shanghai lockdown easing, Russian production cuts (Reuters) - Oil prices settled higher on Tuesday as lockdowns eased in Shanghai and as Russian oil and gas condensate production fell to 2020 lows and OPEC warned it would be impossible to replace potential supply losses from Russia. Brent crude futures rose $6.16, or 6.3%, to settle at $104.64 a barrel by 1:48 p.m. EDT. U.S. West Texas Intermediate rose $6.31, or 6.7%, to settle at $100.60. On Monday, both benchmarks fell about 4%. Shanghai said more than 7,000 residential units had been classified as lower-risk areas after reporting no new infections for 14 days. Districts have been announcing which compounds can be opened up. Meanwhile, the Organization of the Petroleum Exporting Countries (OPEC) warned it would be impossible to replace 7 million bpd of Russian oil and other liquids exports lost in the event of sanctions or voluntary actions. Russian oil and gas condensate production fell below 10 million barrels per day (bpd) on Monday to its lowest since July 2020, two sources familiar with data said on Tuesday, as sanctions and logistical constraints hampered trade. Sources said Russia’s average oil output fell more than 6% to 10.32 million bpd on April 1-11 from 11.01 million in March. The European Union has yet to embargo Russian oil, but some foreign ministers said the option is on the table. “The oil market is still vulnerable to a major shock if Russian energy is sanctioned, and that risk remains on the table,” wrote Edward Moya, a senior market analyst with OANDA. OPEC on Tuesday lowered its Russian liquids production forecast by 530,000 bpd for 2022, but also cut its forecast for growth in world oil demand, citing the impact of Russia’s invasion of Ukraine, soaring crude prices and resurgence of the pandemic in China. Indian Oil Corp (IOC), which bought Russian Urals in previous tenders, has removed the grade from its latest crude tender. U.S. President Joe Biden told Indian Prime Minister Narendra Modi on Monday that buying more oil from Russia was not in India’s interest. IEA member nations are planning to release 240 million barrels over the next six months from May in an effort to calm the market. While the release will ease immediate tightness, analysts suggested it will not solve the structural deficit, and stocks will need to be replenished.
Oil Futures Extend Gains Despite Large Crude Supply Build - -- Oil futures traded on the New York Mercantile Exchange drifted higher in midmorning trade Wednesday despite weekly inventory data from the U.S. Energy Information Administration showing commercial oil stocks spiked well above expectations during the week ended April 8 as refiners surprisingly reduced run rates and demand for distillate fuels eroded to the lowest level since the holiday week of July 4, 2021, underscoring continued demand destruction from slowing economy and rattled supply chains. U.S. commercial crude oil inventories jumped by 9.4 million barrels (bbl) from the previous week to 421.8 million bbl, and are now about 13% below the five-year average, the EIA said. The massive build was bearish against market expectations of a 600,000 bbl gain and 7.757 million bbl build reported by the American Petroleum Institute. Oil stored at Cushing, Oklahoma, the delivery point for West Texas Intermediate, rose by 450,000 bbl from the previous week to 26.3 million bbl. The larger-than-expected build came as domestic refiners slashed run rates 2.5% from the previous week to 90%, compared with analyst estimates for a 0.3% increase. In the week reviewed, refiners processed 15.5 million barrels per day (bpd), which was 424,000 bpd less than the previous week's average. U.S. crude oil production was unchanged at 11.8 million bpd, according to the EIA. In the gasoline complex, commercial inventories fell by 3.6 million bbl to 233.1 million bbl, compared with analyst estimates for inventories to decrease by 600,000 bbl from the previous week. Gasoline demand in the U.S. gained for the second consecutive week through April 8, up by 174,000 bpd to 8.736 million bpd. Distillate stocks rose fell by 2.9 million bbl from the previous week to 111.4 million bbl, and are now about 17% below the five-year average, the EIA said. Analysts expected distillates inventories would be unchanged from the previous week. Demand for distillate fuels continued lower for the third consecutive week through April 8, falling by 163,000 bpd last week to 10-month low 3.484 million bpd. Total products supplied over the last four-week period averaged 19.9 million bpd, up by 1.3% from the same period last year. Over the past four weeks, motor gasoline product supplied averaged 8.6 million bpd, down by 2.3% from the same period last year. Distillate fuel product supplied averaged 3.9 million bpd over the past four weeks, down by 0.3% from the same period last year. Jet fuel product supplied was up 23.1% compared with the same four-week period last year. Near 11:30 a.m. EDT, NYMEX West Texas Intermediate May futures climbed $2.21 to $102.87 bbl, and international benchmark Brent crude rallied $2.67 to $107.30 bbl. NYMEX March RBOB futures advanced 9.02 cents to $3.2425 gallon and the front-month ULSD futures added 8.91 cents to $3.5531 gallon.
Oil prices up over 3% despite big U.S. crude stock build --Oil prices rose on Wednesday as investors grew more discouraged about peace talks between Russia and Ukraine, feeding worries about tight supplies even after U.S. crude stocks rose by more than 9 million barrels in the most recent week. Brent crude advanced $4.14, or 3.96%, to $108.78. U.S. West Texas Intermediate (WTI) crude futures settled 3.63%, or $3.65, higher at $104.25 per barrel. The gains came a day after both benchmarks climbed more than 6%. On Tuesday, Russian President Vladimir Putin said Ukraine derailed peace talks and said Moscow would continue what it calls a "special military operation." U.S. President Joe Biden accused Russia of genocide. The developments reinforced the view "the Ukraine-Russia situation will not be de-escalating any time soon," "The downside for oil prices is limited." The oil market's retreat from late March peaks came partly because buyers are unclear about the extent of potential disruptions to Russian supply. On Monday, Russian oil and gas condensate production fell below 10 million barrels per day (bpd), lowest since July 2020. However, the International Energy Agency (IEA) on Tuesday lowered its expectations for worldwide demand and said it anticipated rising global production could offset Russian oil output losses. The IEA said it expects Russian output to drop 1.5 million bpd in April, growing to close to 3 million bpd in May. The White House is releasing 180 million barrels from U.S. reserves over six months, part of a release of 240 million barrels from members of the International Energy Agency. U.S. production is expected to keep rising from 11.8 million bpd now to about 12 million in 2022. Exports of refined products reached an all-time record, as heavy overseas demand caused U.S. stockpiles to fall. The Organization of the Petroleum Exporting Countries (OPEC), has said it would be impossible to replace expected supply losses from Russia and it would not pump more crude. Reports this week of a partial easing of some of China's tight COVID-19 lockdown measures also underpinned oil prices on the basis they could boost demand. However, weak economic data from China and Japan limited gains. China's crude oil imports slipped 14% from a year earlier, extending a two-month slide in the world's top crude importer. Japan reported its biggest monthly fall in core machinery orders in nearly two years. OPEC on Tuesday cut its forecast for 2022 global oil demand growth, citing Russia's invasion of Ukraine, inflation and resurgence of the pandemic in China. OPEC expects global demand to grow by 3.67 million bpd in 2022, down 480,000 bpd from its previous forecast.
Oil rises on news EU may phase in a ban on Russian oil imports --Oil prices settled higher on Thursday after an early decline as investors covered short positions ahead of the long weekend and on news that the European Union might phase in a ban on Russian oil imports. Brent futures settled up $2.92, or 2.68%, at $111.70 a barrel. U.S. West Texas Intermediate futures closed $2.70 or 2.59% higher at $106.95 a barrel. Both contracts recorded their first weekly gain in April. For several weeks, prices have been the most volatile since June 2020. The New York Times reported that the European Union was moving toward adopting a phased-in ban of Russian oil, to give Germany and other countries time to arrange alternative suppliers. A phased-in ban would force European buyers "to seek alternative sources, some of which in the near term is being met by Strategic Petroleum Reserve releases, but in the future, more supplies coming out of the ground will be required," Andrew Lipow of Lipow Oil Associates in Houston said. The International Energy Agency had warned on Wednesday that roughly 3 million barrels per day of Russian oil could be shut in from May onwards due to sanctions or buyers voluntarily shunning Russian cargoes. Major global trading houses are planning to curtail crude and fuel purchases from Russia's state-controlled oil companies in May, Reuters reported. Russia's Energy Ministry said it was limiting access to its statistics on oil and gas production and exports. "The big question is going to be, how many people are going to want to be short oil going into the long weekend?" Traders also adjusted their position on Thursday as U.S. May crude options expire on Thursday. U.S. oil production forecasts are being revised upwards despite labor and supply chain constraints as higher prices spur more drilling and well completion activity, according to industry experts. U.S. oil rigs rose by two to 548 this week, their highest since April 2020, energy services firm Baker Hughes said in a report. The U.S. Energy Information Administration reported on Wednesday that U.S. oil stocks rose by more than 9 million barrels last week, driven partly by releases from strategic reserves. Analysts in a Reuters poll had anticipated just an 863,000-barrel build. However, on the demand side, Chinese refiners are set to cut crude throughput this month by about 6%, a scale last seen in the early days of the COVID-19 pandemic two years ago, to ease bulging fuel inventories during recent lockdowns, industry sources and analysts said.
Oil up Almost 9% on Week as Supply Scare Hijacks Trade-- Any selloff in oil is only proving to be a buy-back opportunity amid one of the greatest energy markets volatility ever. Crude prices jumped almost 3% on the day and nearly 9% on the week as the market was hijacked once again by a supply scare on news that the European Union might phase in a ban on Russian oil imports. Gains in oil were limited earlier in the day as Chinese refiners appeared set to cut crude throughput this month by about 6%. The reduction would be a scale last seen in the early days of the COVID-19 pandemic two years ago, industry sources and analysts said. But news of the proposed EU ban on Russian oil prompted buyers to swoop in on more lots of crude futures and convinced some shorts to cover their positions as well ahead of the Good Friday holiday, which meant a longer weekend for U.S. markets. “Heading into the long weekend, oil was vulnerable to some profit-taking, but a major pullback is still unwarranted given the supply situation and as economic slowdown concerns are still far from happening,” said Ed Moya, analyst at online trading platform OANDA. Global crude benchmark Brent settled up $2.92, or 2.7%, on the day at $111.70 per barrel. For the week, Brent rose 8.7%, after two back-to-back weekly losses that left it down by 13%. New York-traded U.S. crude benchmark West Texas Intermediate, or WTI, finished Thursday’s trade up $2.70, or 2.6%, at $106.95. For the week, WTI rose 8.8%, after the 13% tumble over two previous weeks. The New York Times reported that the European Union was moving toward adopting a phased-in ban of Russian oil, to give Germany and other countries time to arrange alternative suppliers. A phased-in ban would force European buyers "to seek alternative sources, some of which in the near term is being met by Strategic Petroleum Reserve releases, but in the future, more supplies coming out of the ground will be required,"
Oil Bounces Back for Weekly Gain as EU Moves Towards Russian Oil Ban - Oil notched a weekly gain as traders weighed a global supply deficit, a potential ban on Russian oil from the European Union, and and China’s latest virus lockdowns. West Texas Intermediate settled near $107, rising 8.8% for the week. Oil rallied Thursday afternoon after a report that the European Union is moving toward adopting a phased-in ban on Russian oil. President Vladimir Putin vowed to continue the invasion of Ukraine earlier this week, pointing to a prolonged disruption of Russia’s energy exports. Additionally, the International Energy Agency said in a report that OPEC+ members provided only 10% of their promised supply increases last month. In the U.S., crude stockpiles jumped more than 9 million barrels last week, with over a third of the build attributed to the shift of strategic oil reserves to commercial inventories. At the same time, most stocks of refined products fell, prompting a spike in so-called crack spreads -- the rough profit from turning crude into fuel. “Traders realize a good portion of that came from the Strategic Reserve which now sets at 20 year inventory lows,” said Dennis Kissler, Senior Vice President of Trading, BOK Financial. “Crude storage remains 60.45 million barrels below the five-year average which should keep the buyers active on extreme sell offs.” The oil market has seen a tumultuous period of trading since Russia invaded its neighbor in late February. A recent reserve release by the U.S. and its allies, along with a virus resurgence in China, has weighed on prices in the past few weeks. Yet there are some signs of easing Covid restrictions and China’s central bank is expected to take measures to help bolster a faltering economy. “Government energy intervention, the perceived self-shunning of Russian crude and the erratic buying patterns in recent weeks have all altered the near-term path,” RBC Capital Markets analyst Mike Tran said. Trading looks “volatile and sloppy over the near term as the market digests the onslaught of 240 million barrels of crude unleashed from strategic reserves.” WTI for May delivery rose $2.70 to settle at $106.95 in New York. Brent for June settlement rose $2.92 to settle at $111.70 a barrel. To be sure, the market is still in the grips of a liquidity crunch sparked by surging volatility after a spike toward $140. Open interest in WTI futures fell to the lowest since 2016 on Wednesday, while traders are using options strategies as a way of effectively raising cash in the face of limited sources of capital. Elsewhere, Kazakhstan expects its main oil-export route via Russia to restore full operations in late April, the country’s energy minister said. The nation said it remains concerned about the possible impact of Western sanctions or shipping issues on the flow of crude.
Russian Oil Continues To Flow To India And China - It has been exactly six weeks since Russia invaded Ukraine, with no end in sight to one of humanity's biggest existential crises in modern times. In response to Russia's unprovoked and unjustified war, the United States and the West have hit the rogue nation with a plethora of sanctions, with the latest announced just days ago mostly targeting Russia's financial sector.But so far, Russia's pivotal energy sector has largely been spared. With the exception of Lithuania and Poland as well as self-sanctioning by refiners and bankers, no country has yet to announce a ban on Russia's energy products. So far, Russian oil and gas exports to the EU remain largely unchanged since only the Baltic States have announced a 100% ban on Russian energy imports. Poland, a major thoroughfare for Russian energy supplies, has also been more proactive than most after it took steps to block Russian coal imports and announced steps to halt Russian oil imports by year-end. Poland--home to the ~1.3mb/d Druzhba pipeline that carries Russian crude to several points in Poland, Germany, and the Czech Republic--directly consumes ~330kb/d of Russian crude and imports ~9.4mt of Russian thermal coal in 2020, accounting for ~5% of Russian exports. The EU currently gets about 40% of its natural gas from Russia, which powers everything from household heating to factory production, and makes up around 25% of the bloc's total energy consumption. The flow of "bloody money" to Russia must stop, Kyiv's mayor has said as the West prepares new sanctions on Moscow after dead civilians were found lining the streets of a Ukrainian town seized from Russian invaders. Since Russian forces withdrew from northern Ukraine, turning their assault on the south and east, grim images from the town of Bucha near Kyiv, including a mass grave and bound bodies of people shot at close range, have prompted international outrage. Unfortunately, a ban on Russian oil and gas by the U.S. and the EU might not be as damaging to Russia as the west hopes, with the presence of heavily discounted Urals proving too irresistible for some. India has never been a big buyer of Russian crude despite needing to import 80% of its needs. In a typical year, India imports just 2-5% of its crude from Russia, roughly the same proportion as the United States did before it announced a 100% ban on Russian energy commodities. Indeed, India imported only 12 million barrels of Russian crude in 2021, with the majority of its oil coming from Iraq, Saudi Arabia, the United Arab Emirates, and Nigeria. But reports have now emerged of a "significant uptick" in Russian oil deliveries bound for India.And, it could be all about the money.According to the International Energy Agency (IEA), Urals crude from Russia is being offered at record discounts. Ellen Wald, president of Transversal Consulting, has told CNBC that a couple of commodity trading firms--such as Glencore and Vitol--were offering discounts of $30 and $25 per barrel, respectively, two weeks ago for the Urals blend. Urals is the main blend exported by Russia.The experts say simple economics is the reason why White House pressure to curb purchases of crude oil from Russia have fallen on deaf ears in Delhi.
U.S. Shakes Finger At India For Russian Oil Imports The U.S. has warned India that it was not in its interest to continue importing crude oil from Russia, media reported, citing government officials and White House Press Secretary Jen Psaki.According to a Reuters report that cited unnamed White House officials, during a video call on Monday, the U.S. president had expressed concerns about India's position in the world if it continued relying on Russian energy imports.The same official noted that India had concerns about the increasingly closer ties between Moscow and its regional rival, Beijing.Al Jazeera, meanwhile, cited White House Press Secretary Jen Psaki as saying President Biden had told Prime Minister Modi that the U.S. could help India diversify its energy suppliers."The president … conveyed that we are here to help them diversify their means of importing oil. The imports from the United States are already significant, much bigger than the imports that they get from Russia," Psaki said, adding, "The president conveyed very clearly that it is not in their interests to increase that."However, per the Reuters report, the U.S. president had stopped short of actually asking India to stop buying Russian crude. The External Affairs Minister in New Delhi, meanwhile, brushed off any concern about India's Russian oil purchases, saying that "Probably our total purchases for the month would be less than what Europe does in an afternoon."Indeed, an Economic Times report cited Press Secretary Psaki as saying that Russian oil accounts for about 1 to 2 percent of total Indian oil imports. U.S. imports, by comparison, constitute a tenth of the total.An official White House readout of the call between President Biden and Prime Minister Modi did not mention oil imports at all, with the only reference to the war in Ukraine made with regard to global food security.
India’s Russian Dealings Have Left Biden’s Geopolitical Oil Strategy In Tatters -- Up until recently, Washington thought India could finally and definitively be brought on to its side in the evolving power struggle between the U.S. and its allies on the one hand, and China and its allies (including Russia) on the other. However, a series of quick-fire developments have derailed this optimism, leaving a key part of the U.S. broader Middle Eastern and Asia Pacific military, economic, and hydrocarbons strategy in tatters.The latest example of India not playing the vital role that had been envisioned for it by the U.S. are the plethora of oil deals being done by India with Russia, despite the obvious opposition to such activities from Washington.When the U.S. unilaterally withdrew from the Joint Comprehensive Plan of Action (JCPOA, ‘nuclear deal’) with Iran in May 2018, a key concept in the White House was to use this hard-line stance on Iran to parlay into broader and deeper relationships with other Arab states that had become increasingly alarmed by Iran’s efforts to destabilise the region, as analysed in depth inmy new book on the global oil markets. This was to be achieved in large part through a series of bilateral agreements – later formalised into the ‘relationship normalisation deals’ – to be done between Israel (a power more than equal to Iran in the region, tacitly backed up by the even bigger power of the U.S.) and those Arab states that Washington believed were open to becoming unequivocal allies of the U.S. These included the UAE, in which the U.S. has its Al-Dhafra Air Base, plus Patriot missiles, to help intercept any air assaults by the Iranian-backed Houthis or anyone else. They also included Bahrain (as a proxy for Saudi Arabia, and home to U.S. Naval Forces Central Command, and the Fifth Fleet), and Morocco (a crucially-positioned ally to the U.S. in its counterterrorism efforts, so much so that Washington designated it ‘a Major Non-NATO Ally’ in 2004) and Sudan (also regarded as a potentially important centre for counterterrorism activities by the U.S.).For the Middle Eastern contingent in these deals there was the added incentive for the U.S. that oil flows from these countries could be used in the short-term to counterbalance the net loss of oil to the markets that resulted from new sanctions on Iranian oil flows.Medium-term as well, thought Washington, by investing more money into both the UAE and Bahrain – with more oil-rich countries then encouraged to also sign relationship normalisation deals – they would see significant boosts in their oil production to allow the U.S. to reduce its relationship with non-cooperative Middle Eastern countries.Longer-term, the U.S. planned to be so self-sufficient in oil and gas that it only has to deal with countries that also offer it political allegiance in its struggle to retain its number one global superpower spot in the face of China’s advances. In any event, all of this was to be done whilst ensuring that the price of oil did not stay for any extended periods above the US$75-80 per barrel level at which it starts to cause economic trouble for the U.S. and political trouble for the sitting president at the time, as also analysed in depth in my new book on the global oil markets.
After buying cheap Russian oil, India is now setting sights on its coal --India's hunger for coal is growing. Even as the world shuns Russian goods, the Asian giant is setting its sights on Russian coal – after already buying up its discounted oil. The European Commission last week proposed banning Russian coal as part of a new round of sanctions against Moscow for its invasion of Ukraine. On the other hand, India's coal imports from Russia jumped in March to highs not seen in more than two years, according to data from commodity intelligence firm Kpler. Coal imports from Russia were at 1.04 million tonnes, the highest level since January 2020, Kpler's Matthew Boyle, lead dry bulk analyst, told CNBC in an email. As much as two-thirds of March's volume came from Russia's Far East ports, likely after the war began in late February. "Markets suspect that India and China may boost coal imports from Russia, offsetting some of the impact of a formalised EU ban on Russian coal imports," Vivek Dhar, director of mining and energy commodities research at the Commonwealth Bank of Australia, said in a note last week. Last week, India said it planned to double imports of Russian coking coal, used to make steel. "The EU ban on Russian coal imports comes at a time when the international coal market is already very tight, with correspondingly high prices," said Rystad Energy in a note. "A surge in coal demand in Asia, as countries try to minimize imports of expensive natural gas, has sent coal prices soaring in the past year."
Shipping Russian Oil Gets Costlier -Daily earnings for tankers shipping oil from Russia’s Baltic ports are soaring as shipowners continue to exercise caution about hauling the country’s crude. It now costs more than $348,000 a day to charter an oil tanker from the port of Primorsk to northwest Europe. That’s the highest since at least 2008, according to data from the Baltic Exchange in London. The increase is another sign of the discounts Russian producers will have to apply to their supplies in order to find buyers. Russian Urals crude was offered at almost $35 a barrel below the Dated Brent benchmark price last week, at a time when tanker earnings were about $100,000 a day lower than they are now. Assuming a freight cost of about $7 a barrel, it means producers would receive a discount of more than $40. Rates for cargoes from Russia have been spiking since the war broke out. Most owners have steered clear of dealing with Russian cargoes and ports, as a raft of self-sanctioning sweeps over the oil industry, pushing up costs. For smaller Aframax ships, which carry about 700,000 barrels of oil, the situation has been compounded by Russia’s Sovcomflot PJSC being the largest owner of such vessels. With traders staying away from Russian entities, the availability of smaller ships has decreased. Additional costs have also been mounting. London insurers recently extended their list of areas where underwriters can charge extra premiums to all Russian waters. At the start of the conflict those so-called Listed Areas included only parts of the Black Sea and Sea of Azov, but now additional costs are filtering through to other export ports. Last week, ships entering the Black Sea were almost uninsurable as underwriters were asking for as much as 10% of the value of a ship’s hull to cover a voyage.
No comments:
Post a Comment